A DIAGNOSTIC SYSTEM MEASURING ORTHOGONAL FACTORS OF SOUND FIELDS IN A SCALE MODEL OF AUDITORIUM M. SAKURAI S. AIZAWA Y. SUZUMURA AND Y. ANDO |
|
Based on the model of auditory-brain system which consists of the autocorrelation mechanism, the interaural crosscorrelation mechanism between the both auditory pathways, and the specialization of human cerebral hemispheres [Ando, Architectural Acoustics, Blending Sound Sources, Sound Fields, and Listeners, AIP Press/Springer-Verlag, New York, 1998], a new diagnostic system was developed. After obtaining the binaural impulse response, four orthogonal factors including the SPL, the initial time delay gap between the direct sound and the first reflection, the subsequent reverberation time and the IACC can be analyzed for the calculation of the scale values of both global and individual subjective preferences. In addition, two more factors extracted from the interaural crosscorrelation function, τIACC and WIACC, can be figured out. Also, the sound energy, Φ(0), the effective duration, τe, and fine structures of autocorrelation function of sound signals including the magnitude of first maximum, φ1, and its delay time, τ1, can be analyzed. As an example of the measurement, effects of reflectors' array above the stage in a 1/10 scale model of auditorium at each seat are discussed here. |
|
In order to measure orthogonal factors, SPL, Dt1,
Tsub, IACC, τIACC,
and WIACC [1-6], and also the running ACF of sound field at
each seat in a scale model as well as in a real auditorium, a diagnostic
system is developed. Based on the model of auditory-brain system which
consists of the autocorrelation mechanism, the interaural crosscorrelation
mechanism between the both auditory pathways, and the specialization of
human cerebral hemispheres as shown in FIGURE 1 [1], a diagnostic system
was designed.
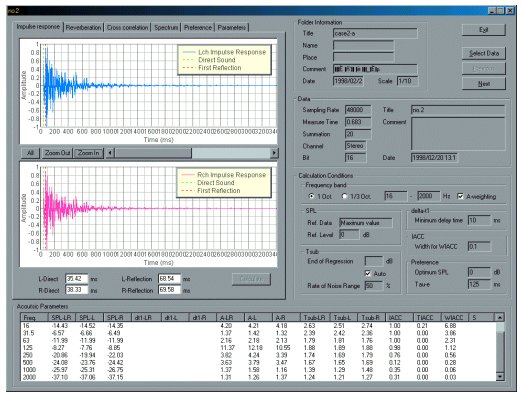
The system works on PC for Windows with an AD & DA
converters, there is non need for special additional devices. After
obtaining the binaural impulse responses, four orthogonal factors
including the SPL, the initial time delay gap between the direct sound and
the first reflection, the subsequent reverberation time and the IACC are
analyzed. These factors are used for the calculation of both the scale
values of global and individual subjective preferences. In addition to the
four factors, two more factors, τIACC
and WIACC as defined in FIGURE 2, extracted from the interaural
crosscorrelation function can be figured out for evaluating the image
shift of sound source and the apparent source width [6],
respectively.
Also, the averaged sound energy, F(0),
the effective duration, τe,
defined by the delay at which the envelope of normalized ACF becomes 0.1 (FIGURE
3), and fine structures of autocorrelation function of sound signals
including the magnitude of first maximum, f1,
and its delay time, τ1,
of source signals are analyzed.
In order to examine effects of reflectors' array above the stage in a 1/10 scale model of auditorium, the IACC measurements are demonstrated here. |
|
Because the complex requirements made
the system difficult to evaluate, an advanced diagnostic system and a
high-power computer was used. The measuring system was utilized to obtain
the binaural impulse response at each listening position. The sound was
created using an omni-directional loudspeaker fed with a maximum-length
signal produced by a diagnostic system in a notebook PC. The period of
maximum-length signal (MLS) was between 1024 and 524288 samples, and the
sampling rate can be changed between 8 kHz and 48 kHz. The acoustic signal
amplified from the two microphones placed at the entrances of ears of a
1/10 scale model of dummy head (a sphere with the diameter of 25 mm) was
sampled after passing through a low pass filter (FIGURE 4). The
binaural-impulse-response measurement may be performed by a summation of
the output data from the linea system, without any multiplication
operation [7.8]. The measurement was done automatically within only a few
seconds by pushing a single button. It took another few seconds for the
analysis of the orthogonal acoustic factors and the scale value of the
subjective preference. And at the same time this program can took the
result to compute the acoustic parameters and prepare the reports.
|
|
3.1. PROCEDURE The diagnostic system developed may
examine effects of scattered reflections of complex boundary conditions of
the room. The reflectors above the stage are designed mainly for the
performer obtaining the preferred reflections according to the program
sources. We measured the IACC of sound field at each seat to find effects
of reflectors' array above the stage [10]. The effective direction of
reflections to listeners for the 2000 Hz range is centered on +- 18
degrees from the median plane, which might be realized by the reflectors
above the stage [1]. Therefore, the IACC of the 2000 Hz-frequency band is
selected here to be examined.
|
|
As mentioned above, in order to examine
effects of reflectors' array on the IACC for the 2000 Hz range at 15
seating positions shown in FIGURE 6, measurements were performed with and
without reflectors above the stage. As indicated in this figure, the
location of the sound source is marked by a star, and triangular
reflectors` arrays [10] are installed above the stage. FIGURE 7
shows the measured results of the IACC without reflectors, and
FIGURE 6 shows those with reflectors` array. The IACC values of the 2
kHz-frequency band for a real room were measured at the 20 kHz frequency
band in the 1/10 scale model.
As shown in these figures, the reflectors decrease results of the IACC at the 9 measuring points, so that acoustic quality is much improved. Especially, the decrement of IACC values was remarkable in the frontal area close to the stage in audience floor except for the center, due to the reflections from above the stage to the listeners. |
|
It is shown that measurements in the 1/10 scale model for acoustic parameters by the diagnostic system may prove effects of reflectors' array and other scattering elements which may not available by calculation at the design stage. In order to examine the sound fields after the construction of the auditorium, the diagnostic system measuring orthogonal factors may be applied. Also, keeping the subjectively optimal conditions, this system may be applied for the automatic control of sound fields by the use of electro-acoustic systems. |
|
1. Y. Ando 1998 Architectural Acoustics - Blending Sound Sources, Sound Fields, and Listeners, AIP Press/Springer-Verlag, New York. 2. H. Sakai, Y. Ando et al. 1997 Inter-individual differences in subjective preference judgments of sound fields in Music and Concert Hall Acoustics, Y. Ando and D. Noson (Eds.), Academic Press, London, chapter 13. 3. Y. Ando et al. 1997 Global subjective evaluations for design of sound fields and individual subjective preference for seat selection in Music and Concert Hall Acoustics, Y. Ando and D. Noson (Eds.), Academic Press, London, chapter 4. 4. M. Sakurai et al. 1997 A sound simulation system for seat selection in Music and Concert Hall Acoustics, Y. Ando and D. Noson (Eds.), Academic Press, London, chapter 6. 5. S. Sato, Y. Mori and Y. Ando 1997 The subjective evaluation of source locations on the stage by listeners in Music and Concert Hall Acoustics, Y. Ando and D. Noson (Eds.), Academic Press, London, chapter 12. 6. S. Sato and Y. Ando 1997 The apparent source width (ASW) for music source in related to the IACC and the width of the interaural crosscorrelation function (WIACC), 134th meeting of ASA, San Diego. 7. Alrutz. H 1981 Ein Neuer Algorithmus zur Auswertung von Messungen mit Pseudo-Rausch Signalen, Fortschritte der Akustik DAGA 81, 525-528, Berlin. 8. Y. Ando 1985 Concert Hall Acoustics, Springer-Verlag, Heidelberg, appendix E. 9. Y. Suzumura, Y. Ando, M. Sakurai, M. Oowaki, T. Iizuka, and I. Yamamoto, 1999 An Evaluation of Scattered Reflections in Sound Fields (Unpublished) 10. T. Nakajima, Y. Ando, and K. Fujita 1992 Lateral low-frequency components of reflected sound from a canopy complex comprising triangular plates in concert halls, J. Acoust. Soc. Am., 92, 1443-1451. |