Chapter 3 Diagnostic System for sound fields in a Room
3.1. Introduction
In order to measure orthogonal factors, SPL,
DT1, Tsub, IACC, tIACC,
and WIACC[37-42],
and also the running ACF of sound field at each seat in a scale model as well as in a real auditorium,
a diagnostic system is developed.
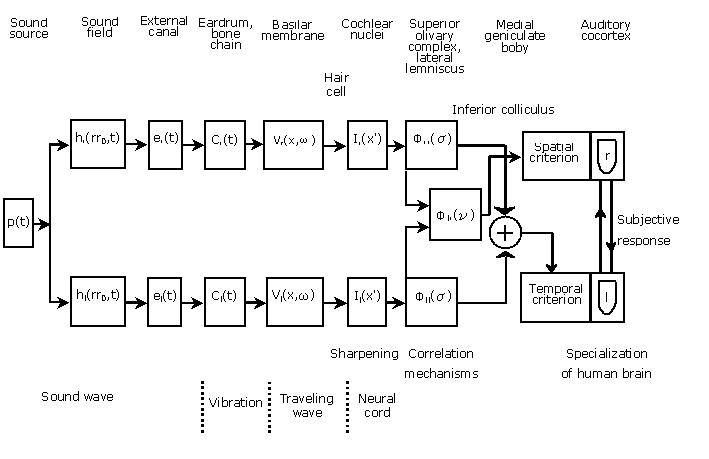
Based on the model of auditory-brain system which consists of the autocorrelation mechanism,
the interaural crosscorrelation mechanism between the both auditory pathways,
and the specialization of human cerebral hemispheres as shown in Figure 3.1 [37],
a diagnostic system was designed.
Figure 3.1. A model of auditory-brain system.
The system works on PC for Windows with an AD & DA converters,
there is non need for special additional devices.
After obtaining the binaural impulse responses,
four orthogonal factors including the SPL,
the initial time delay gap between the direct sound and the first reflection,
the subsequent reverberation time and the IACC are analyzed.
These factors are used for the calculation of both the scale values of global and individual subjective preferences.
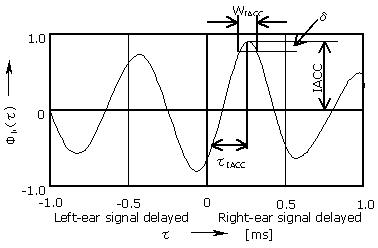
In addition to the four factors, two more factors, tIACC
and WIACC as defined in Figure
3.2,
extracted from the interaural crosscorrelation function can be figured out
for evaluating the image shift of sound source and the apparent source width [42], respectively.
Figure 3.2. Definitions of the IACC, tIACC
and WIACC in the interaural crosscorrelation function.
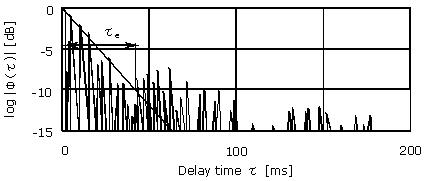
Also, the averaged sound energy, F(0),
the effective duration, te,
defined by the delay at which the envelope of normalized ACF becomes 0.1 (Figure
3.3),
and fine structures of autocorrelation function of sound signals including the magnitude of first maximum,
f1, and its delay time, t1,
of source signals are analyzed.
In order to examine effects of reflectors' array above the stage in a 1/10 scale model of auditorium,
the IACC measurements are demonstrated here.
Figure 3.3. A practical example of determining effective duration of ACF
defined by the ten-percentile delay, with the straight line-fitting envelope of
ACF from 0 to -5 dB.
3.2. Outline of a Diagnostic system
Because the complex requirements made the system difficult to
evaluate, an advanced diagnostic system and a high-power computer was used. The
measuring system was utilized to obtain the binaural impulse response at each
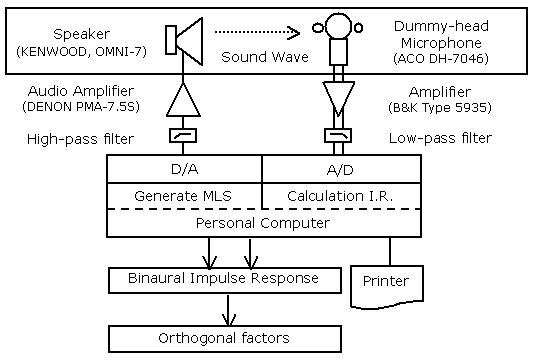
listening position. The sound was created using an omni-directional loudspeaker
fed with a maximum-length signal produced by a diagnostic system in a notebook
PC. The period of maximum-length signal (MLS) was between 1024 and 524288
samples, and the sampling rate can be changed between 8 kHz and 48 kHz. The
acoustic signal amplified from the two microphones placed at the entrances of
ears of a 1/10 scale model of dummy head (a sphere with the diameter of 25 mm)
was sampled after passing through a low pass filter (Figure 3.4).
Figure 3.4. A block diagram of the measurement system.
The binaural-impulse-response measurement may be performed by a summation of the
output data from the linea system, without any multiplication operation [43,
44]. The measurement was done automatically within only a few seconds by
pushing a single button. This is realized by the logic that the Dt1
is obtained automatically (Appendix B).
It took another few seconds for the analysis of the orthogonal acoustic factors
and the scale value of the subjective preference. And at the same time this
program can took the result to compute the acoustic parameters and prepare the
reports.
3.3. Application of the Diagnostic system (I) for the Kirishima International
Concert Hall after Construction
A. Comparison between Simulated and Measured Values of Orthogonal Factors
The Kirishima International Concert Hall contains 770 seats
and has a volume of 8,475 m3. In order to increase the number of seats close to
the stage, the width of the hall was increased from 17.9 m to 19.7 m (1.8 m)
just before construction.
The physical factors at each seat were measured using a
maximum length sequence sound signal [33].
The signal was reproduced by an omnidirectional dodecahedron loudspeaker placed
1.5m above the stage floor. The sound source was located either at the center of
the stage (S1) or 2 m to the side of the center (S2). Sixty-four seats were
selected to test the source location S 1 and 6fty-Gve seats for the source
location S2. At each seat, the acoustic signals were recorded by two small
microphones at the entrances of the ear canals of a real person. In order to
obtain the impulse responses, the signals were analyzed using the Hadamard
Transformation. Using the impulse responses at both ears, the physical factors
LL, Dt1 , Tsub , IACC, and
A-Value were calculated for all octave bands with center frequencies between 125
Hz and 4 kHz.
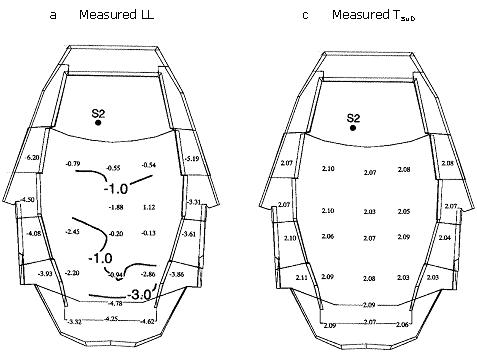
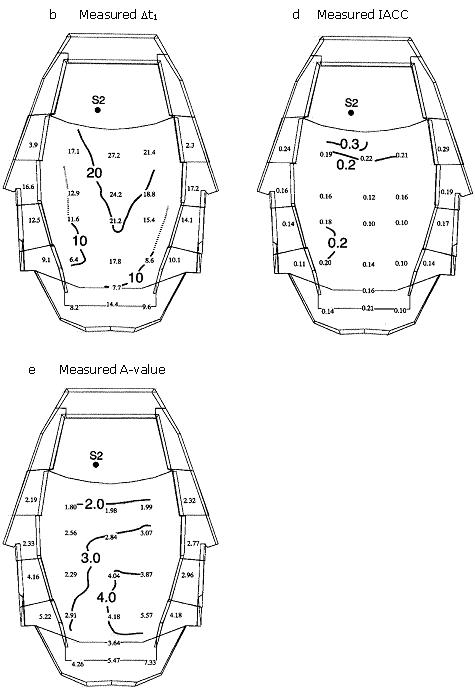
The measurements of the physical factors (LL and Tsub
at frequencies of 500Hz, IACC for white noise, Dt1,
and A-Value) for S2 are shown in Figure 3.5.
Figure 3.5. Results of measured values of physical factors for source
position S2: (a) Contour lines of equal relative-listening level (500Hz) [dB];
(b) Contour lines of initial time delay gap between the direct sound and first
reflection excluding the floor reflection [ms]; (c) Values of reverberation time
(500Hz); (d) Contour lines of equal IACC (for white noise) (e) Contour lines of
equal A-value.
The listening levels indicated are relative to those at the front seat near the
centre line. The range of the values is similar to that of the calculated
results, that is, 8.5dB for Sl and 6.5 dB for S2. The largest initial time delay
is 29ms and is not much different from the calculated value (27ms), in spite of
the change in hall width. The reverberation time Tsub Obtained by the
decay rate between -5 dB and -20 dB is almost constant throughout the hall, and
has a range of j=0.05 s (unoccupied). It is estimated to be about 1.75 s when
the hall is occupied, which is close to the design goal (1.8 s). The IACC values
for frequencies above 500 Hz are less than 0.5 throughout the hall, and the
interaural time delay tIACC for S1 is
constant at zero for almost all seats. Generally, the IACC at each seat is
smaller for source position S2 than for S 1. With regard to the physical factors
of upper level seating, the contour lines between calculated and measured values
cannot be compared because there were few measuring points. The differences
between calculated values and measured values throughout the seats measured (23
points) are as follows; LL: ±1.0 dB, Dt1:
±3.0ms and IACC: ±0.05.
In spite of the change (about 10 percent) in the width of the
hall, reasonable agreement between calculated and measured values of the four
physical factors was obtained in the design Process.
B. Remarks
In this study, the system had been developed, which can
measure four orthogonal factors including the SPL, the initial time delay gap
between the direct sound and the first reflection, the subsequent reverberation
time and the IACC, in order to diagnose sound fields of each seat in the concert
hall at its completion based on the model of auditory-brain system.
The usefulness has been revealed by comparison between the
orthogonal factors obtained by actual measurement at Kirishima concert hall's
completion and the orthogonal factors obtained by simulation at the planning
stage.
3.4.
Application of the Diagnostic System
(II) for the 1/10-Scale Model of the Tsuyama Music Cultural Hall
A. Effects of Reflectors Above the Stage (1) Procedure
The diagnostic system developed may examine effects of
scattered reflections of complex boundary conditions of the room. The reflectors
above the stage are designed mainly for the performer obtaining the preferred
reflections according to the program sources. We measured the IACC of sound
field at each seat to find effects of reflectors' array above the stage [46].
The effective direction of reflections to listeners for the 2000 Hz range is
centered on +- 18 degrees from the median plane, which might be realized by the
reflectors above the stage [37].
Therefore, the IACC of the 2000 Hz-frequency band is selected here to be
examined.
In order to obtain reliable results, measurements were
repeated several times until obtaining the same results of the binaural impulse
responses. The sound is produced using an omni-directional loudspeaker fed with
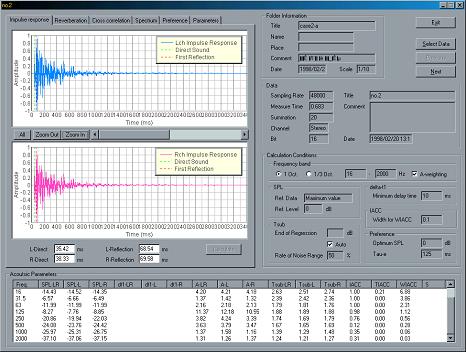
the MLS produced by the diagnostic system in a notebook PC. Figure 3.6 shows the
window on PC of actual diagnostic system with the data obtained from the impulse
responses. In the measurement, a special attention should be made to maintain a
suitable value of the signal to noise ratio adjusting the power level of the
loudspeaker.
Figure 3.6. An example of display window of the diagnostic system, with
binaural impulse responses.
(2) Results
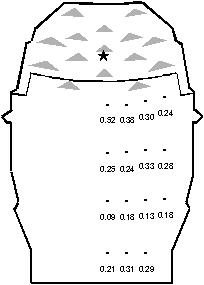
As mentioned above, in order to examine effects of
reflectors' array on the IACC for the 2000 Hz range at 15 seating positions
shown in Figure 3.7, measurements were performed with and without reflectors
above the stage.
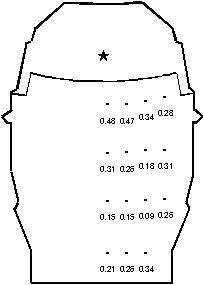
Figure 3.7. Measured IACC for the 2000 Hz-frequency band with reflectors
above the stage.
As indicated in this figure, the location of the sound source is marked by a
star, and triangular reflectors` arrays [46]
are installed above the stage. Figure 3.8 shows the measured results of the IACC
without reflectors, and Figure 3.7 shows those with reflectors` array. The IACC
values of the 2 kHz-frequency band for a real room were measured at the 20 kHz
frequency band in the 1/10 scale model.
Figure 3.8. Measured IACC for the 2000 Hz-frequency band without
reflectors above the stage.
As shown in these figures, the reflectors decrease results of
the IACC at the 9 measuring points, so that acoustic quality is much improved.
Especially, the decrement of IACC values was remarkable in the frontal area
close to the stage in audience floor except for the center, due to the
reflections from above the stage to the listeners.
B. Remarks
It is shown that measurements in the 1/10 scale model for
acoustic parameters by the diagnostic system may prove effects of reflectors'
array and other scattering elements which may not available by calculation at
the design stage. In order to examine the sound fields after the construction of
the auditorium, the diagnostic system measuring orthogonal factors may be
applied. Also, keeping the subjectively optimal conditions, this system may be
applied for the automatic control of sound fields by the use of electro-acoustic
systems.