| Japanese | English |
This time, the frequency response and the Total Harmonic Distortion (THD) are measured at the listening point by using the sweep signal.

| Date | 12 July 2002 |
| Loudspeaker | Omni-directional speaker, KENWOOD OMNI 5 |
| Microphone | SONY ECM999 |
| Amplifier | DAT TASCAM DA-P1 |
| PC | DELL INSPIRON 7500 |
| OS | Windows 2000 Professional |
| Software | DSSF3 |
Before the measurement, setting of PC and software is checked.
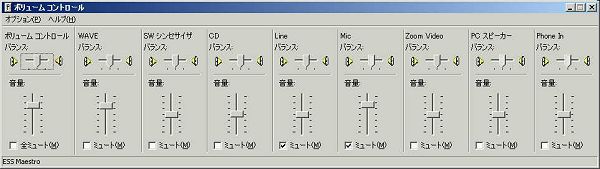
This is the playback volume control of Windows.
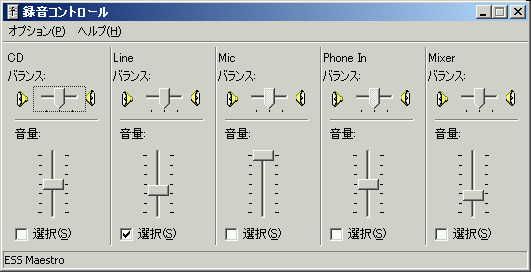
This is the recording volume control.
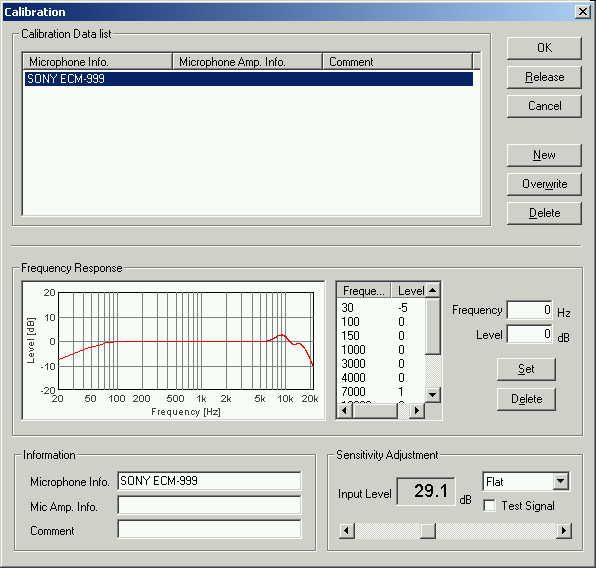
Microphone is already calibrated. For how to calibrate microphones, see the program manual of RA.
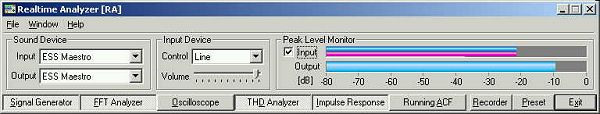
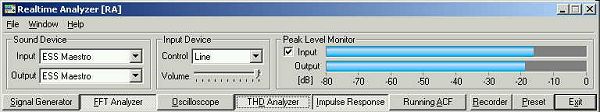
This is the main window of RA (DSSF3 version5). Adjust the input peak level monitor not to overload. Also, check that the output volume is below -10 dB. Unless the output level is adjusted, the signal generator's output is distorted in the analog amplifier just after the D/A conversion. Output level can be adjusted by the digital volume of the signal generator. See here for more instruction.
Now, 1/3 octave analysis is performed by using the signal generator's pink noise as a test signal.
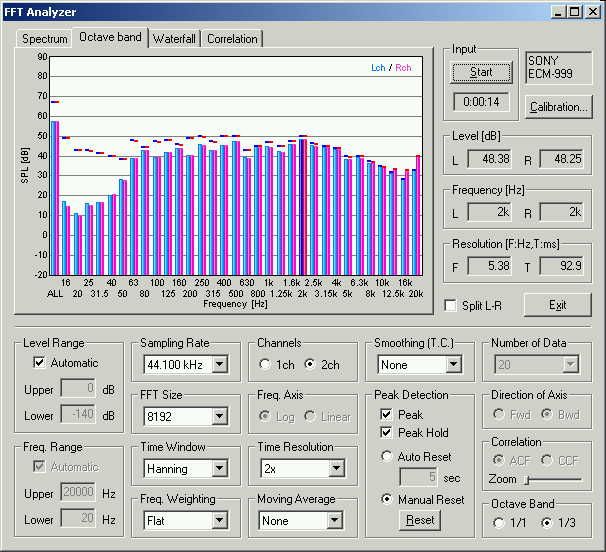
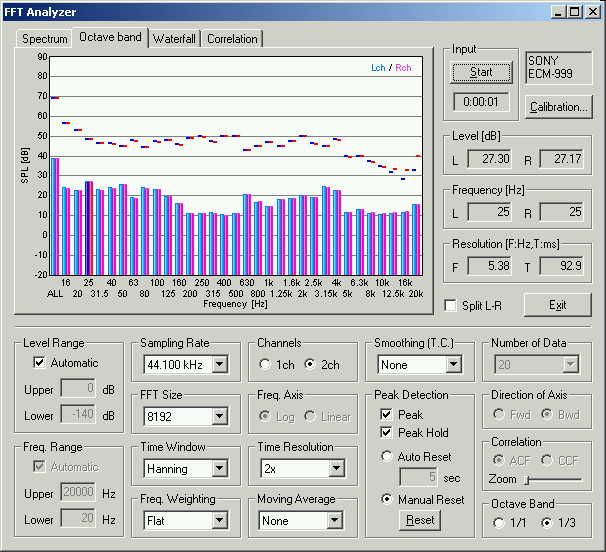
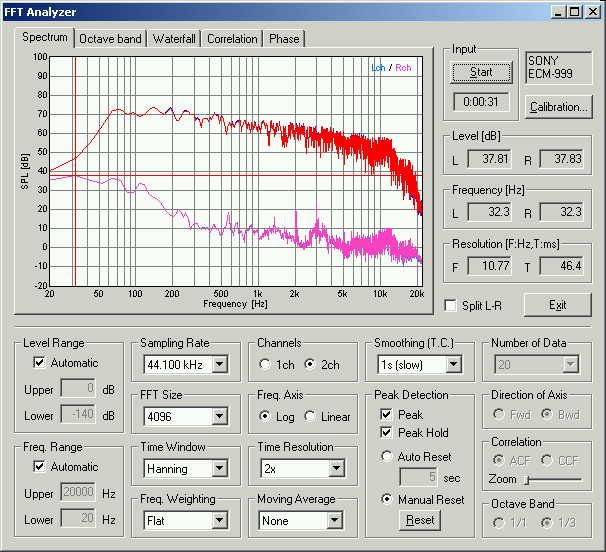
This time, the frequency response of the loudspeaker is measured. So the frequency weighting of the FFT analyzer is set to FLAT. The figure below shows the 1/3 octave analysis of the background noise of a room.
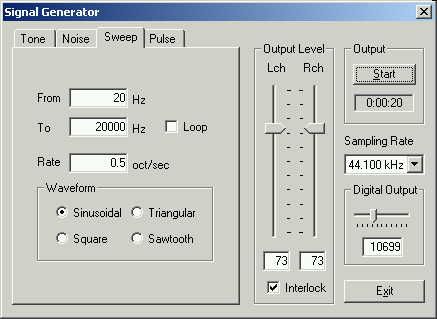
This is a setup of the signal generator. By using the sinusoidal sweep signal, frequency response at the listening point is measured.
The lower curve shows the background noise, and the upper curve shows the loudspeaker's output. It was measured by using the peak hold function.
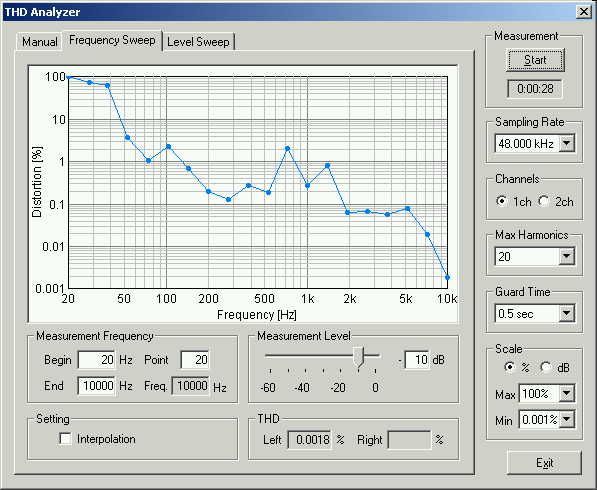
Next, the Total Harmonic Distortion (THD) is measured.
This is a result of the frequency sweep measurement by the THD analyzer measured at the listening point. It seems that OMNI5 has a good quality in the frequency range between 100 and 10k Hz.
July 2003 by Masatsugu Sakurai