| Japanese | English |
This time is a report of the car stereo measurement inside Ferrari. Engine sound during idling and the reproduced music is analyzed.
| Idling sound | |
| Reproduced music (Vivaldi, The four season) |
Mechanical noise and exhaust noise at the time of idling were first measured inside the car by the running ACF. I was interested in how the exhaust sound and the engine sound, which were recorded outside before, is heard inside the car. Since the sound is interrupted, exhaust sound should be heard differently inside and outside the car.
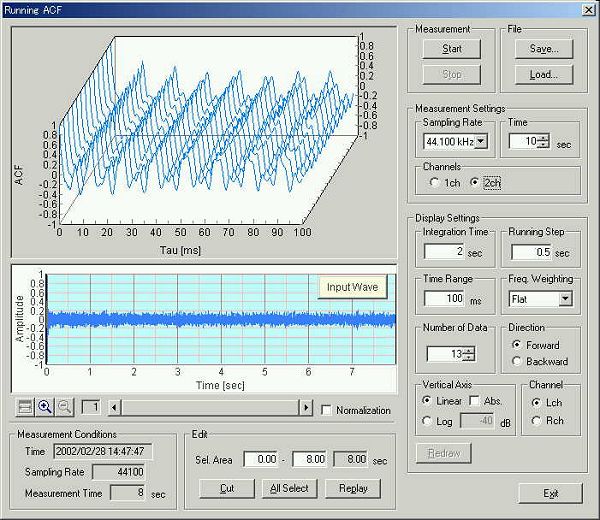
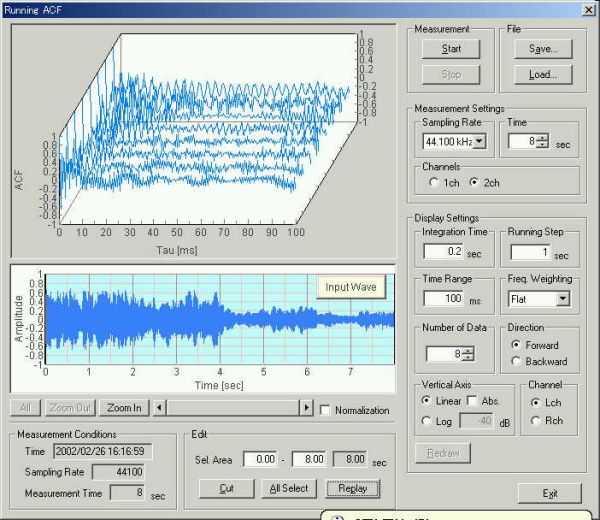
This is the running ACF measurement inside the car during idling.
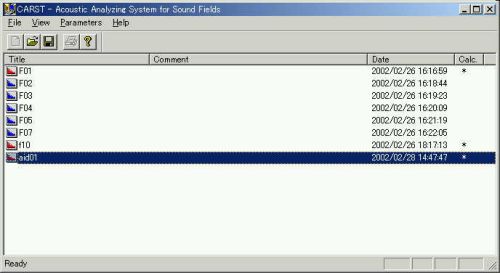
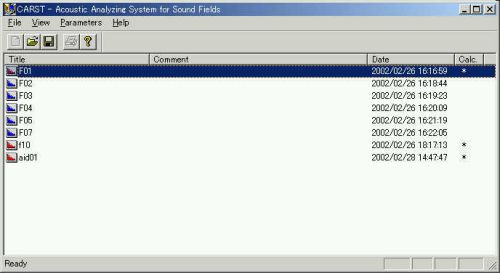
Data is read and calculated by SA (Sound Analyzer). A data "aid01"
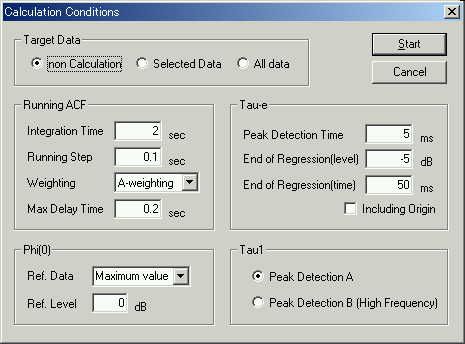
is analyzed here. It was calculated with the integration time of 2 s.
Calculation took
3-4 minutes.
The reference sound level (0 dB) is set to the maximum level of the music
analyzed later. As shown in the figure below, sound level of the engine noise is -20 dB,
so the S/N ratio is 20 dB.
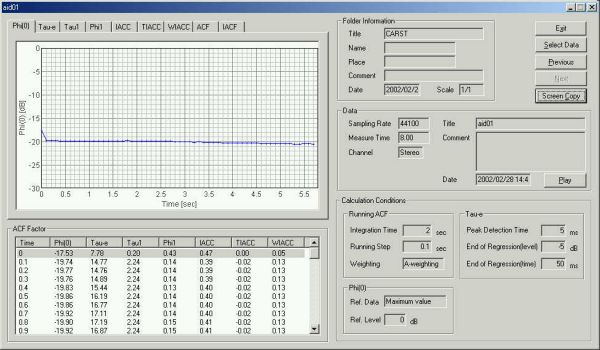
It is the time history of other parameters.
As reported in Car Stereo Measurement 1, the noise outside a car was 58 dB (where the engine was stopped). Background noise inside the car was 36-39 dB (the door and window are closed and the engine is stopped). It is as quiet as the silent room at night. The sound isolation effect is about 20 dB. However, at the time of idling, the noise level inside the car increased up to 62.5 dB, 4.5 dB higher than the background noise outside. This is equal to the engine sound heard outside of other cars. The engine sound outside of Ferrari is 75 dB or more. This is the same level as a jet aircraft.
Acoustical parameters of idling sound
| t1 | F1 | te | F(0) | |
| Outside the car | 2.8 ms | 0.11 | 6-8 ms | 75 dBA |
| Inside the car | 2.3 ms | 0.11 | 10-20 ms | 62.5 dBA |
The t1 value (the first peak of the ACF) is 2.3 ms inside the car. It means that 400 Hz is the dominant frequency component of this sound. Comparing this value with the outside sound (t1 is 2.8 ms, it is 357 Hz in frequency), it is found that the sound inside the car is heard as higher pitch than outside. The F1 values for both sounds are 0.11, that shows weak pitch sound or noise-like sound is perceived.
In the ACF waveform in the graph above, you can see a peak at 27 ms. This component shows the fundamental frequency of the engine sound. In this case, it corresponds to the explosion interval in the engine cylinder (1000/27= 37 Hz). In the outside measurement, this component was found at 32 ms (its frequency is 1000/32=31.25 Hz). So it is found that the rotational speed of the engine was slightly lower. When the rotational speed increases, it is possible that more resonance frequency comes out and a tonal quality of sound changes.
The te value (10 % decay rate of the ACF) of the
inside sound (10-20 ms) is longer than the outside sound (6-8 ms). This
parameter expresses the reverberant component of sound. So, it means that the
inside sound has longer reverberation than the outside sound.
Next, a music reproduced by the car stereo is analyzed. Music piece is the first movement of Concerto No.1 in E Major, RV 269, "SPRING" -Allegro, from the Vivaldi's "The four season" -Le quattro stagioni. Background noise level is 38-39 dBA. The beginning of the first movement is measured.
The display of 1/3 octave analysis.
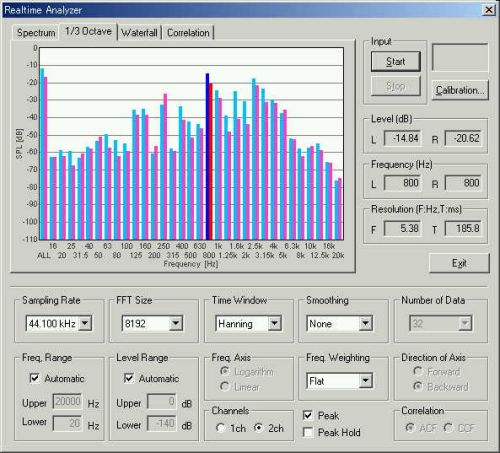
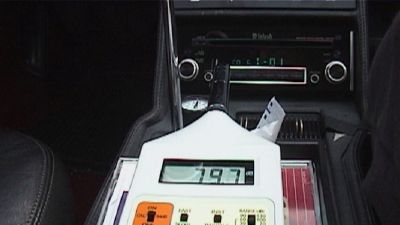
The sound level is about 80 dBA.
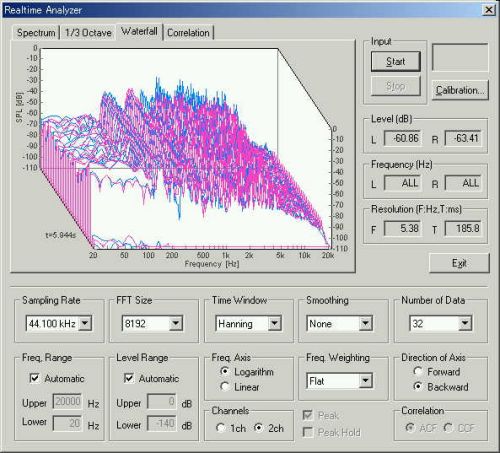
The time-frequency display of the power spectrum.
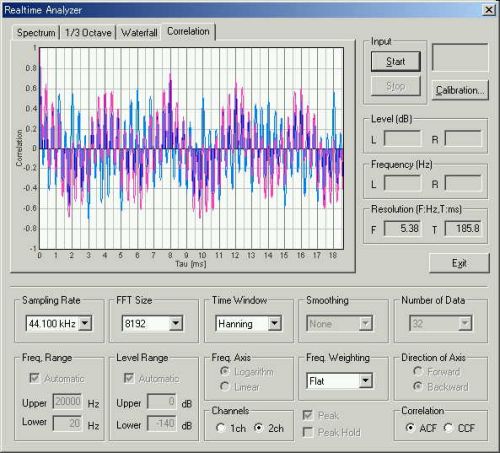
The real time display of the autocorrelation function. It shows very complex waveforms.
It is a characteristic of the music signal.
The running ACF measurement was performed for 8 seconds.
Data is calculated in SA.
Calculation conditions are set as follows.
The figure shows the time course of the sound level. The dynamic range of
sound level is about 11 dBA during 6 seconds. When the music sound becomes
small, it will come to be influenced by the idling sound, since the level of
idling sound is -20dBA.
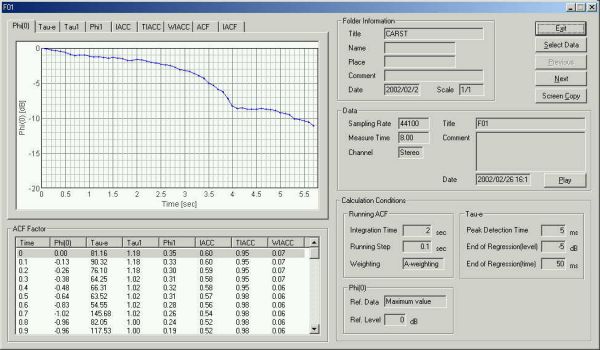
The screen copy of calculation results.
As a measurement result, pitch of this music piece changes between 800 and 1500 Hz. In this frequency range, the value of IACC is about 0.3. This is a good condition for listening to the music. When the IACC becomes low values, good spatial impressions can be obtained. It seems that space like a car cockpit is a good listening environment.
The measurement reported in this page was done by using DSSF3.
April 2003 by Masatsugu Sakurai