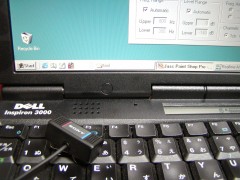
 | A miniature condenser microphone of SONY Walkman was connected to the microphone input terminal of DELL laptop. Input device setting was changed to "Microphone". We can now measure sounds from the external microphone. Necessary equipments for sound measurement and other audio testing can be found in this page. |
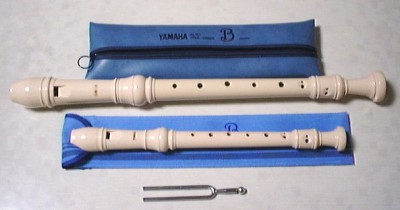
From top to bottom we have an alto recorder, a soprano recorder, and a tuning fork. Let's start the measurement of a soprano recorder.
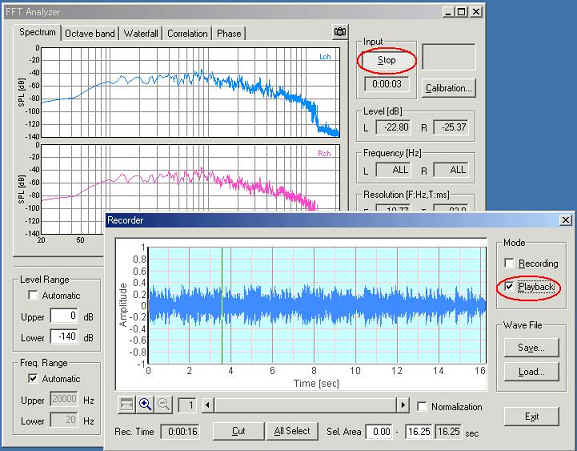
Start Realtime Analyzer, open the FFT analyzer, and click the Start button. Parameter settings can be ignored at first. Measurement of the power spectrum starts immediately, and the results are displayed in real time.
 | Sound pressure levels are stronger on the left (lower frequencies), and there are several peak frequencies. But it is difficult to follow those peaks, because the "Freq. Axis" is Linear. Let's change the frequency axis into Logarithm and look at the spectrum again. |
 | Now it is easier to follow the frequency peaks. The logarithmic axis allows us to see a broad frequency range. The peak on the left is the fundamental frequency (500 Hz), and the series of peaks on the right are harmonics (1 kHz, 1.5 kHz, 2 kHz...). Musical instruments generally have their own pattern of harmonics. This pattern decides the timbre of the instrument. It may be interesting to see how different the spectra of different instruments are. |
 | If
you want to see a limited frequency range, release the "Automatic" checkbox
of "Freq. Range" and set the upper and lower limit. Here, upper limit
was set to 800 Hz and the lower limit to 300 Hz. Freq. Axis was also changed
to Linear. Now we can see the fundamental frequency is around 530 Hz. This frequency roughly matches the fundamental tone of the soprano recorder, C5: 523.3 Hz. If you increase the FFT size, this peak becomes sharper and the more precise fundamental frequency can be seen. |
 | Next, we measured the sound from the tuning fork (A4: 440 Hz). The left graph actually shows a peak at 440 Hz. The relationship between the notes of the tuning fork and the soprano recorder is 440 * 2 ^ (3/12) = 523.3. |
 | This is the full range spectrum of the tuning fork. You can see that there are fewer harmonics than of the soprano recorder. We can assume this means the tuning fork generates a monotone sound. |
News: In the latest version of DSSF3, the spectrum analyzer can be used with the sound recorder. Once the sound is recorded, the same portion of data can be analyzed repeatedly. For how to use the recorder, see the program manual.