Pulse signal is generated with specified length, number of time, interval, and polarity. This is used for the measurement of the impulse response or the polarity of the loudspeaker.
Operation of the pulse generator (In this report, DSSF3 version 5 is used).
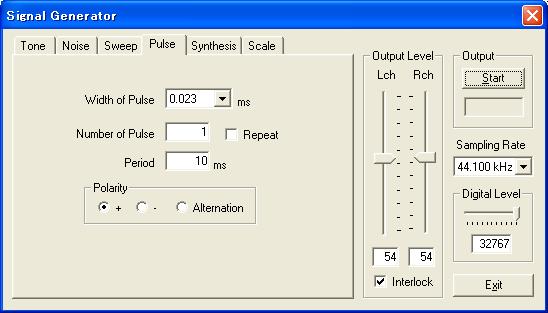
Open the Signal Generator window from the main window of RA (Realtime Analyzer). Open Pulse tab. "Width of Pulse" changes depending on "Sampling Rate". At 44.1 kHz, the sampling speed allows its smallest value of 0.023ms. In this example, the width of pulse is set to 0.023 ms. Number of pulse is 1 and its period is 10 ms.
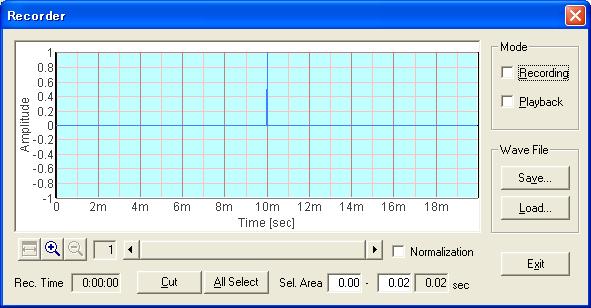
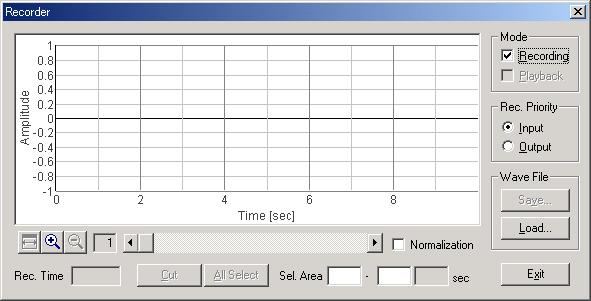
To check the waveform of this pulse, the recorder is used. First, confirm that the input device in the RA's main window is set to "WAVE", to measure the signal generator's output signal. Then, open the recorder window and check the "Recording" mode. Then click the start button of the signal generator. Output signal is automatically recorded in the recorder. The figure below is the result. One pulse is recorded at 10 ms.
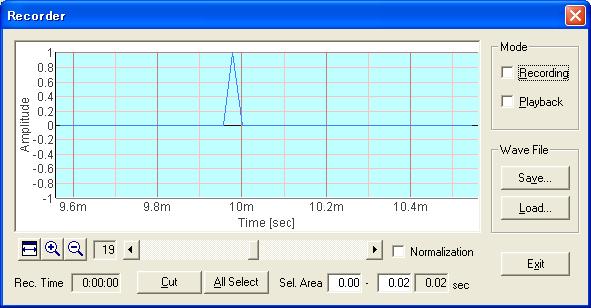
The recorded waveform was zoomed in to x19 in the figure below. In this figure, we can see that the very short pulse with the maximum volume is recorded. If the width of pulse was set to longer values, the waveform becomes square. If the polarity was set to minus "-", the amplitude becomes minus values.
The recorded sound can be saved as a wav format. A wav file can also be loaded on the recorder, and by using the "Playback" mode, it is automatically measured by the FFT analyzer or the oscilloscope.
Impulse response measurement
By using the pulse generator and the sound recorder, the impulse response of the electronic circuit can be measured. We cannot generate a true Dirac Impulse function, but it can be approximated with a very narrow square pulse as shown above.
As a test, PC's soundboard (Creative SB Live! Basic) was measured.
Input and output of the soundcard was connected directly by the audio cable, and the "line-in" was selected as the input device in the main window of RA.
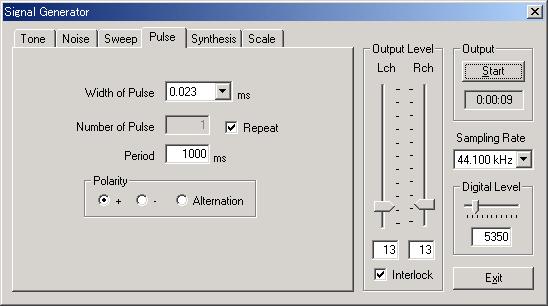
Set the parameters of the signal generator as below. Make sure that the "Width of Pulse" is the smallest, and "Period" is much longer than the length of the expected impulse response. Check the "Repeat" box to generate a series of pulses. Start the signal generator.
Open FFT analyzer (or Oscilloscope) and just click "Start" button. No setting is needed. This step is necessary for recording the input signal in the recorder.
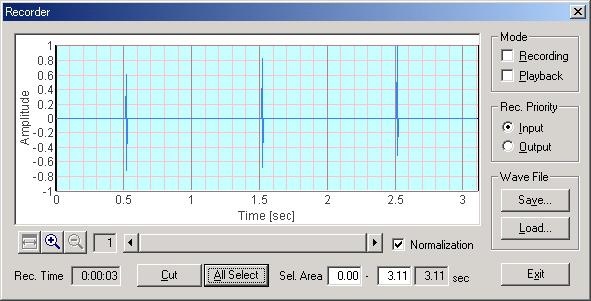
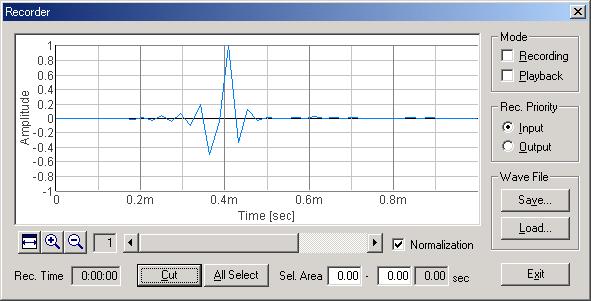
Open the recorder. Set the "Rec. Priority" to "Input". Then, check the "Recording" box to start recording.
After a few pulses are recorded, release the Recording box to stop recording. Check the "Normalization" box to see the waveform in a full amplitude range.
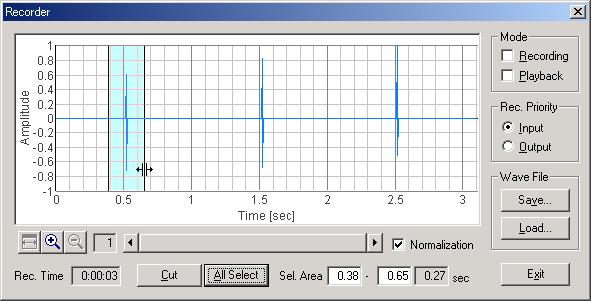
Only one response is selected from the recorded signal. Right click on the waveform and drag to select the area to save as below. Then, click the "Cut" button.
Only the selected area remains. Repeat the same operation again if necessary.
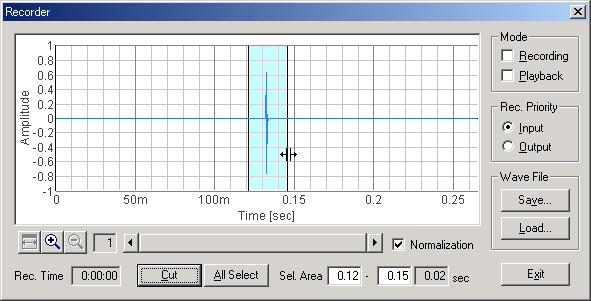
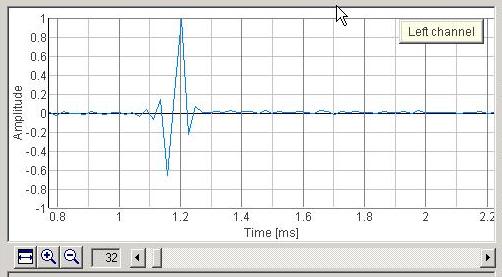
Below is the impulse response of the soundcard. Displayed time range is 1.0 ms. Recorded signal can be analyzed by the FFT analyzer with Playback mode, and can be saved as a wav format.
For comparison, the impulse response was measured by the different method (MLS signal) for the same configuration. From the RA's main window, the Impulse response window is selected. Note that this function is available only in the higher versions of DSSF3, RAD and RAE (see Function list).
Set the conditions as below, and click the Start button. Measurement will finish at an instant.
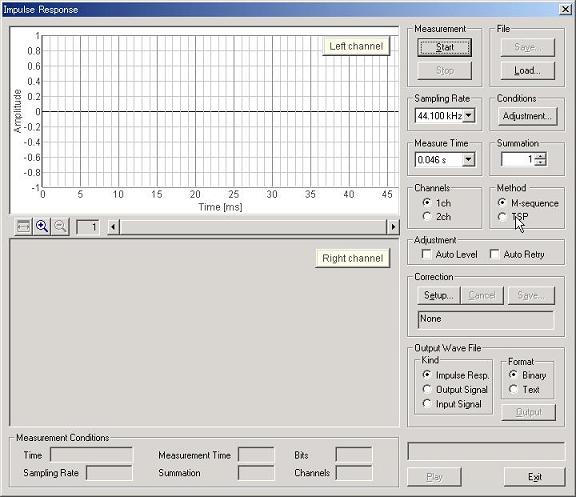
Below is the measured impulse response. Almost the same function was obtained as above.
When people wanted to measure the reverberation time in halls or other venues, they would clap their hands and listen to the sound. We now have equipment called a reverberation time meter, which generates pulses for measurement. But because it is difficult to obtain high signal-to-noise (S/N) ratio in the real environment, pulse signal is not practical for the measurement. DSSF3 can measure the reverberation time through the analysis of "Impulse Response" measured by the MLS signal. This requires a much more complex explanation, however, so we won't go into it here. See the concert hall measurement report and the impulse response measurement guide.