By using the PC's built-in microphone and DSSF3, you can see the spectrogram of your voice very easily. This feature must be a valuable tool for singing voice training, speech therapy, or measurement of voice quality. Of course, any other kind of signals can be analyzed in the same way.
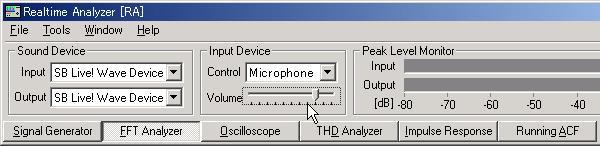
In the Realtime Analyzer's main window, set the input device to Microphone. Open the FFT analyzer window, open the Spectrogram tab, and click the Start button. Detailed settings can be ignored at first. When you speak to the microphone, signal is analyzed and displayed in real-time.
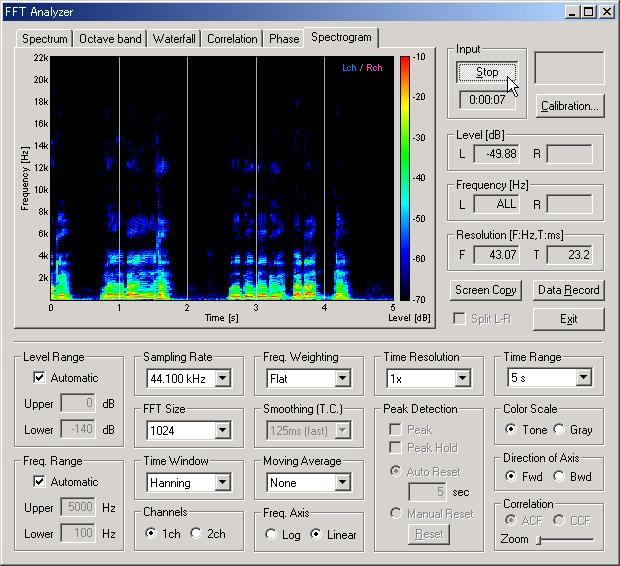
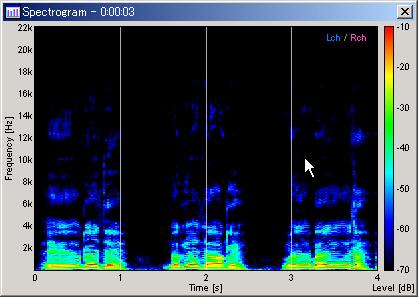
In the figure below, the spectrogram of the spoken speech is displayed. Horizontal axis represents time in second, and vertical axis represents frequency in Hz. Color and corresponding level is indicated. Display time can be selected from the "Time Range" box. Display is scrolled from right to left. Scrolling direction can be selected from Forward and Backward (Fwd is a normal setting). Level range and Frequency range are set automatically, but those values can be set manually, off course.
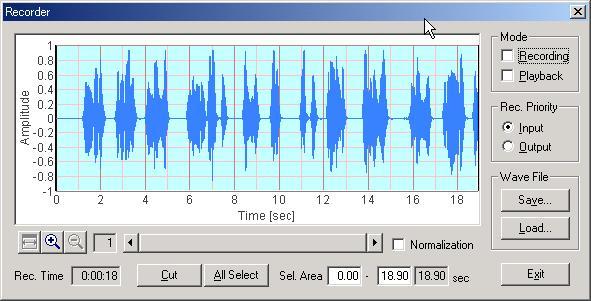
Input signal can be recorded and analyzed later in detail. To do this, open the Recorder from RA's main window. Check the "Recording" box on the Recorder window. Then, go back to the Spectrogram view and click the start button. Spectrogram is displayed as before, but this time, the signal is recorded simultaneously. Recording continues until the stop button is clicked. The next figure shows the recorder window after the recording is finished. The recorded sound can be saved as a wav format at this point.
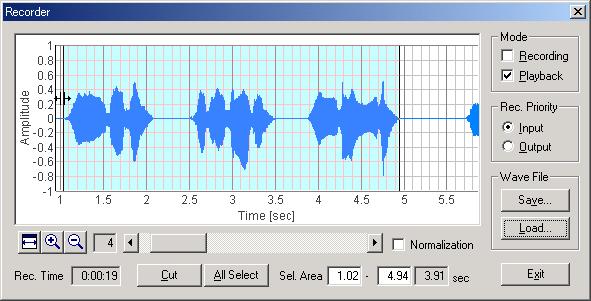
The waveform can be edited if only a particular portion is necessary. Right click and drag on the waveform display to select the area to save. Selected area is indicated as blue as shown below. Then, click the "Cut" button to delete the unselected area. It is important to remember that this command cannot be undo. So, it is recommended that the important recording is saved at once for making a copy, and edited later.
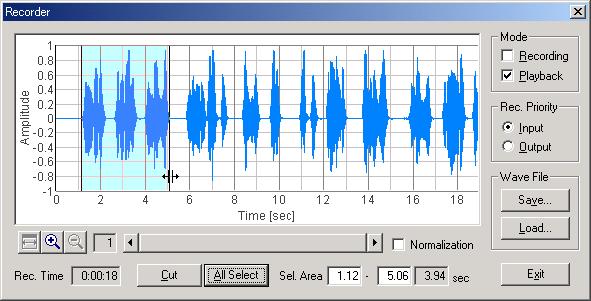
Mouse drag can also be used to select the signal portion that is to be playedback. Only the selected portion will be replayed and analyzed by the spectrogram and other analyzers. To do this, check the "Playback" mode on the recorder, and start the spectrogram.
The selected portion of speech was analyzed. This picture was created by the screen copy button on the FFT analyzer.
The waveform is zoomed up to x4. Compare the spectrogram and the waveform.