A test signal widely used in the audio measurement is a sine tone whose frequency is changed continuously. This signal is called the "frequency sweep". The two most commonly used types of the sweep are the linear sweep and the logarithmic sweep (or called exponential sweep). The linear sweep has a fixed rate of frequency per time (Hz/sec) and has a flat frequency spectrum like the white noise. In the logarithmic sweep, the frequency increases with a fixed rate of octave change per time (Octave/sec). This means that every octave contains the same energy, similar to the pink noise. So, the long term power spectrum of the logarithmic sweep decreases at 3 dB/octave.
In the signal generator of DSSF3's Realtime Analyzer, the logarithmic sweep can be generated with the specified start and end frequency, the sweeping rate (octave/sec), and the waveform shape. In this page, it is explained about the nature of the sweep signal, and how to perform the frequency response measurement by using the sweep and the spectrum analyzer.
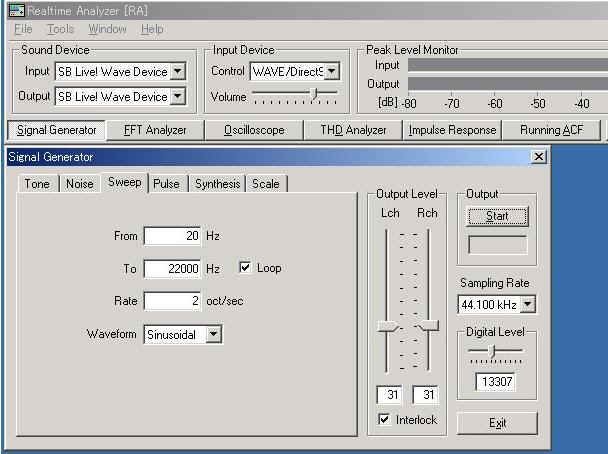
Start the Realtime Analyzer, open the Signal generator, and click the Sweep tab. Set the parameters as the following screen copy. The frequency increases from 20 Hz to 22000 Hz at the rate of 2 oct/sec. By clicking the Start button, you can hear a sine tone with the increasing frequency.
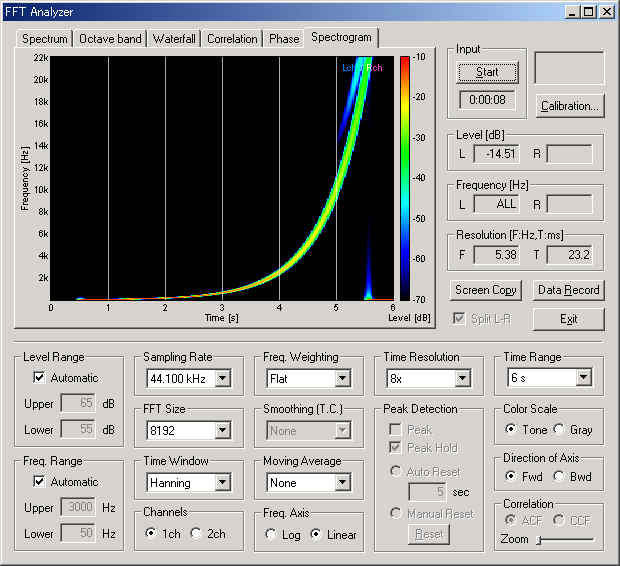
To see how does the frequency change, we will see the spectrogram. In the spectrogram, the signal energy is represented in a color map as a function of time (X axis) and frequency (Y axis). Open the FFT analyzer and click the Spectrogram tab. Set the parameters as below and start the measurement. You can see that the frequency is increasing exponentially when the frequency axis is Linear. If you change the frequency axis to Log, you will see the straight line instead.
To see the signal waveform, the sound is recorded by the Recorder. Now the sweep rate is increased to 100 oct/sec. Then, open the Recorder and check the "Recording" mode. Set the Rec. Priority to "Output" to record the output of the Signal generator. By clicking the start button on the signal generator, the recording starts and ends automatically. The signal waveform is displayed on the Recorder window as follows. X axis is time (second) and Y axis is amplitude. We can see that the signal is a sine wave whose frequency is rapidly increasing in time. The amplitude of the sinusoid is constant during sweeping.
Below is the same sweep signal, but it was recorded via the PC's built-in soundcard. I connected the headphone-output terminal to the microphone-input terminal directly, to record the output signal of the soundcard. Before the recording, open FFT analyzer and just click "Start" button. No setting is needed. Then, get back to the Recorder window and set the Rec. Priority to "Input". These steps are necessary for recording the input signal on the recorder. Recording will start by marking the "Recording" checkbox, and ends by removing the check mark.
As you can see in the figure below, the amplitude of the sinusoid is not constant. The amplitude is higher at the beginning and the end of sweeping. It means that the low and high frequencies are boosted by the soundcard. This frequency response is caused by a combination of the headphone-out and the microphone-in.
Next is the WAVE input of the soundcard. Now the signal envelope is almost constant, though it is slightly attenuated at the end of signal. Because the X axis of this graph is not the frequency, it is difficult to say at what frequency the attenuation begins. To draw a conventional frequency response curve, spectrum analyzer is necessary. But you can see the rough frequency response of the audio equipment by only recording the sweep signal.
Next, we will see how to draw the frequency response curve by using the sweep tone and the spectrum analyzer (power spectrum and octave band analyzer). Frequency response is definitely one of the crucial specification in determining the quality of microphones, loudspeakers, amplifiers, and other audio equipments. Flat frequency response is necessary to transmit the signal correctly.
We begin with the measurement using the broadband noise excitation. Below is the power spectrum of the white noise passing through the WAVE input. Because the white noise contains equal power in all frequencies at the same time, the spectrum measured directly represents the system's frequency response.
Similarly, the pink noise can be used as an excitation signal. Because the pink noise contains equal energy in every octave, the amplitude in the spectrum attenuates at 3 dB/octave. So, the pink noise should be measured by the octave band analyzer, instead. Below is the octave analysis of the same system. You can see that the response is almost the same to the power spectrum above.
Combination of the white noise and the spectrum or the pink noise and the octave analysis is a simple and quick measurement. So they are widely used in the audio measurement. A problem of testing by the noise excitation is that the response is not smooth: rather, it has a irregularity which may mask the true response curve. To minimize this irregularity, small FFT size and long smoothing time constant are recommended. In the example above, the FFT size of 1024 and the smoothing time constant of 1 sec are used.
Sine sweep is an alternative to the broadband noise for the frequency response measurement. It is said that the sweep is preferable to the broadband noise in measuring the frequency response, because the sweep is less affected by the background noise, can detect steep peaks and dips, and the distortion can be observed during the measurement. We can obtain much smoother response curve by using the sweep signal than using the broadband noise.
It is important to remember that the sweep signal is always changing, but the spectrum analyzer only sees one portion of the signal at a time. Peak hold is necessary to measure the full frequency scale in a single session. Also, it is worth noting that the frequency sweep is exponential and the Fourier transform is performed in a linear time scale. To measure the sweep response correctly, attention must be paid to the setting of the measurement conditions. The most important items are the sweep rate of the signal and the FFT size of the analyzer, which decide the amount of changes included in one analysis data frame. If we measure with the wrong settings, some artifacts would appear in the result and we can't get the accurate response.
Let's see how the different settings affect the result. Octave band analysis would be appropriate for the sweep measurement than the power spectrum, because the log sweep has a pink spectrum. To obtain a smooth and continuous response, "Time Resolution" is set to 8x and "Peak Hold" is used with the Manual Reset. Smoothing and Moving average should not be used to obtain the instantaneous response. Start the analyzer, then start the signal generator. After the sweeping is finished, the result appears as the held peaks on the measurement screen.
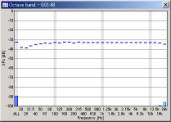
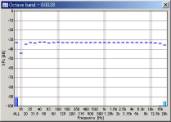
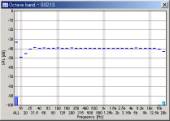
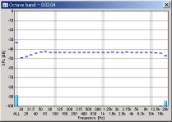
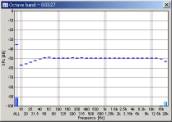
Below is the octave analysis results of the sweeps passing through the WAVE input. The parameters considered here are the FFT size of the analyzer and the sweep rate (oct/sec) of the signal. Sweep range was fixed to 20-22000 Hz.
We can see that the mid to high frequency range resembles the pink noise response. The results seems reasonable in all conditions. However, the attenuation in the low frequency range becomes great when the FFT size is small. This attenuation is not the actual response, but an artifact of the analysis. The attenuation is the smallest when the FFT size of 16384 is used. From our test, the FFT size between 8192 and 32768 would give reasonable results. Also note that the low frequency attenuation appears when the sweep rate is high, even in the large FFT size. This is another artifact, but it disappears if the start frequency of the sweep is lowered to, for example, 10 or 5 Hz.
| FFT size = 1024 | 4096 | 16384 | |||
| 1 oct/sec | 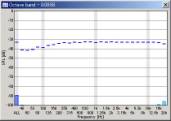 |
 |
 |
||
| 10 oct/sec | 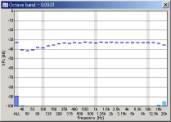 |
 |
 |
||
| 100 oct/sec | 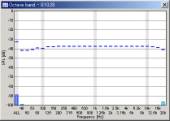 |
 |
 |
As mentioned above, the (long term) power spectrum of the log sweep is same as the pink noise, in which the amplitude decreases at 3dB/oct. So, we think that the octave analysis is a simple and appropriate method for the sweep measurement. But it is not impossible to measure sweep by using the spectrum. A recommended method is to measure the very slow sweep with a small FFT size. Below is the measured spectrum of the sweep of 0.1 oct/sec with the FFT size of 1024. Though it takes long time, we can obtain much smoother and accurate response than the white noise.
Updated on 2005/04/27