| Japanese | English |
This measurement was first done in 2003. I intended to analyze the heartbeat, because I have heard the motion of heart, the blood flow, and the closing sound of heart valve, from the recorded heart sound.
Since the first measurement, DSSF3 has been much improved. The FFT analysis and the ACF analysis can be performed on exactly the same data. So, I decided to analyze the same data again. The results of the new analysis are reported in this page after the original report.
Original report written in 2003
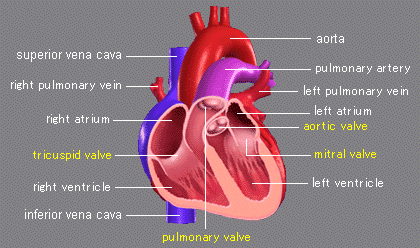
As described before, the 1st sound of heartbeat is a closing sound of a mitral valve and a tricuspid valve. It is heard at the early stage of contraction. The 2nd sound is a closing sound of an aortic valve and a pulmonary valve. It is heard at the end of contraction. In this report, timing of those valve movements will be analyzed in relation to the sound quality of heartbeat.
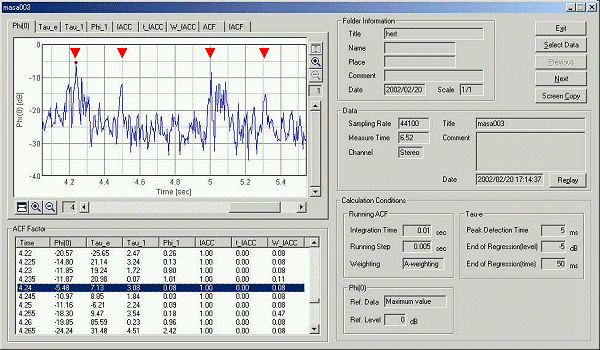
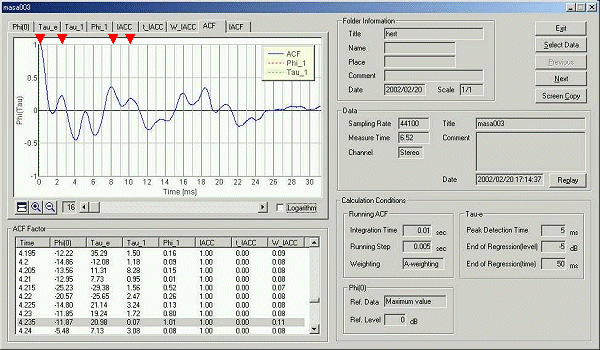
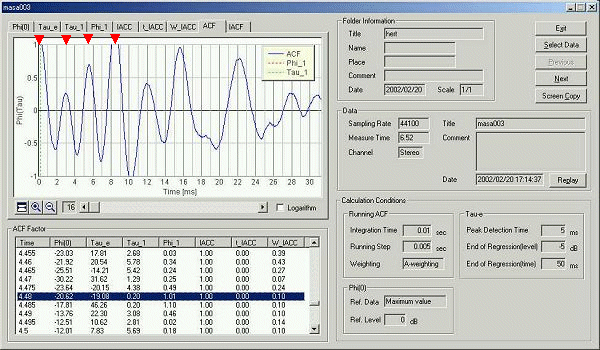
The figure below shows the time history of the sound level. The sound level is expressed as the relative level in dB. Time unit is 100 ms. As an overview, the first heart sound is seen at around 4.2 s and the second heart sound is seen at 4.5 s. Next first and second heart sounds are seen at 5.0 and 5.3 s. Analyzed parameters at 4.24 s (for first heart sound) is highlighted in the table.
At 4.24 s, the Tau_e value is 7.13 ms. It means that the reverberation of sound is very short. The small value of Phi_1 (0.08) suggests the sound has a very weak pitch. So, this sound may not show the movement of the valve although the sound level is maximum. If the strong pitch is looked for, there is a point where the Phi_1 is 1.0 at 4.235 s, just before the peak sound level. At this point, the frequency component is as high as 14000 Hz (Tau_1 is 0.07 ms).
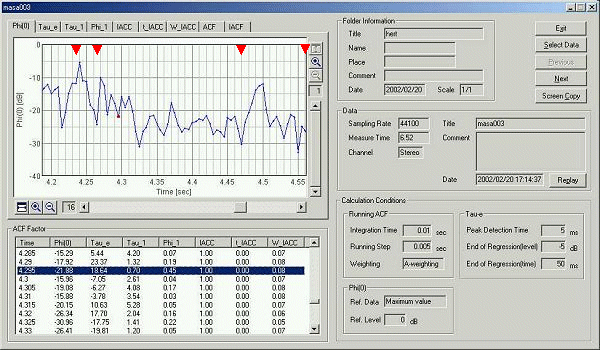
The point indicated by the red mark seems a closure of the mitral valve. When this sound is heard through the stethoscope, it is a very powerful burst sound. The mitral valve fills the left ventricle with blood, which is sent from lungs through the pulmonary vein with oxygen, and closes the left atrium. This movement is recorded at 4.235 s. Immediately after this point, a sound like "dok" occurs since blood flows in a main artery. The frequency of this blood flow sound is around 330 Hz. Then, just after 30 ms of the mitral valve closure, a sound caused by the closure of the tricuspid valve occurs. It is at 4.265 s in the graph above. The tricuspid valve has a role to prevent the blood, which is containing the carbon dioxide sent from the whole body, to flow backwards. Those two sound components (closure of the mitral valve and the tricuspid valve) are the major audible components of the 1st sound.
After the 1st sound, blood is sent out to lungs through the pulmonary artery. This movement is recorded from 4.47 to 4.56 s. To stop sending of blood, the aortic valve (which stops the exit to a main artery) and the pulmonary valve (which is an exit to the pulmonary artery) closes. The 2nd sound is caused by the closure of those two valves. This is the mechanism of 1st and 2nd sound in which the heart contracts and blood is pressed out. On the contrary, when the heart swells and blood is collected, the 2nd sound is followed by the 1st sound.
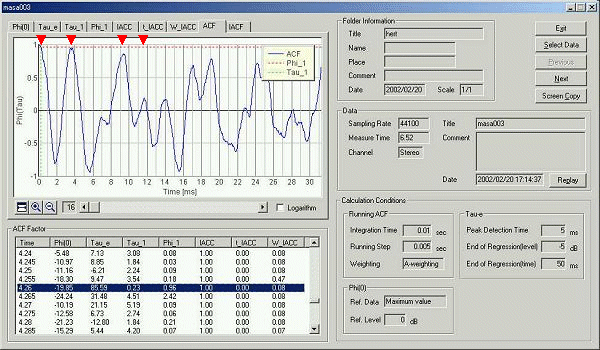
The graph below is the ACF waveform measured at 4.235 s (when the 1st sound is heard). It has the maximum at 250 ms, where the correlation with the 2nd heart sound is large. The 2nd sound is analyzed later in detail. Now, the 1st sound is analyzed in detail by use of the ACF parameters. The sound quality is expressed in the beginning of the ACF.
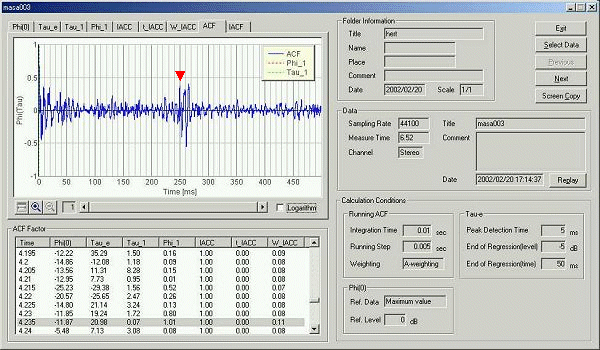
The ACF is zoomed in for the first 30 ms. This part of the ACF expresses the tonal quality of the mitral valve sound. The strong frequency components are read from the ACF. Same as the analysis of the speech signal, the dominant frequency components (i.e. harmonics) are read from the ACF waveform. Those values are listed in the table below.
| 0.07 | 14000 Hz |
| 2.52 | 400 Hz |
| 8.07 | 125Hz |
| 10.11 | 100 Hz |
The graph of the sound level is zoomed in to the 4.26 s. At this point, the sound has a strong pitch of 5 kHz.
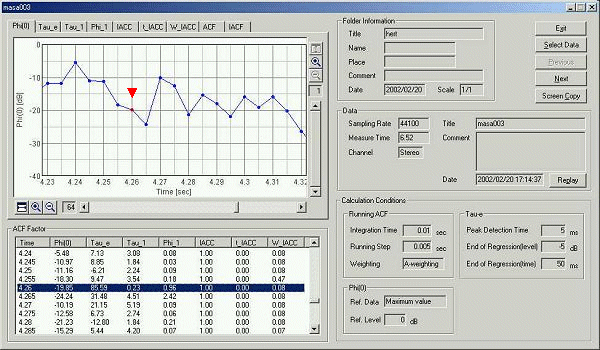
The ACF is zoomed in to the first 30 ms. It shows the second valve sound (tricuspid closure) which causes the first heart sound.
| 0.23 | 5000 Hz |
| 3.7 | 280 Hz |
| 9.3 | 100 Hz |
| 11.7 | 90 Hz |
It has a lower frequency than the first valve sound.
It seems that the aortic valve is closing between 4.47 and 4.485 s. At the beginning of the closure (4.47-4.475 s), pitch frequency decreases from 800 Hz to 200 Hz (Tau_1 value changes from 1.29 to 4.38 ms). At the moment of the closure (4.48-4.485 s), a 5 kHz strong pitch component (Tau_1 is 0.2 ms, Phi_1 is 1.0) is observed. This component seems to express the closure of the aortic valve.
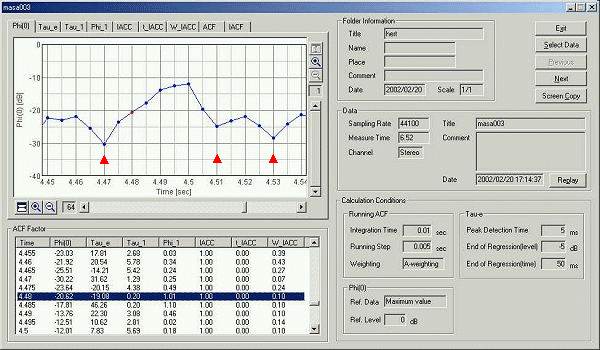
This graph shows the sound level around the aortic valve sound that causes the 2nd sound. The high frequency tonal sound is generated at 4.48 s. Comparing with the first heart sound, this sound lasts long. It seems that the valve moves slowly. The ACF at 4.48 s is zoomed in to the first 30 ms. It shows the aortic valve sound.
| 0.23 | 4000 Hz |
| 3 | 330 Hz |
| 5.5 | 180 Hz |
| 8.5 | 120 Hz |
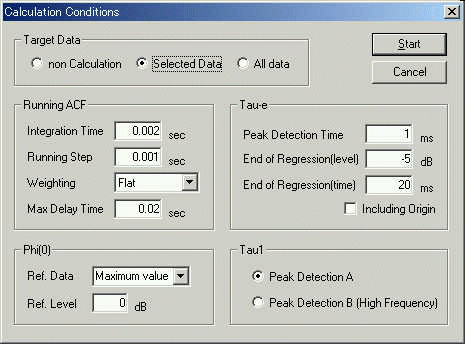
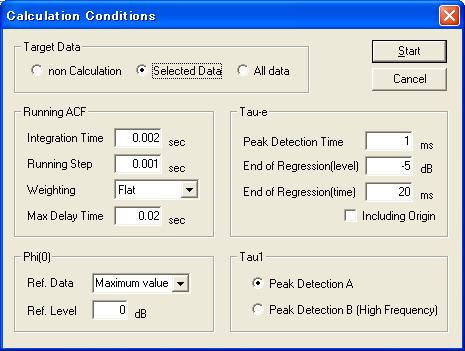
In this analysis, the integration interval is set to 10 ms. It means that the sound level is averaged for 10 ms. Also, the calculation interval (running step) is set to 5 ms. To analyze the sound quality of heart sound, the analysis of the sound level alone is not sufficient. For example, the timing of the mitral valve closure could not be found only by observing the sound level. In my analysis, however, sound quality such as pitch height and pitch strength is easily found by using the ACF parameters (1/Tau_1 expresses pitch [Hz] and Phi_1 (0 to 1) expresses the degree of the pitch strength).
In the previous measurement report including this time, the integration time and the running step were always set to 10 and 5 ms. However, I felt that higher time resolution is needed to measure the movement sound of heart valves. Because the impulsive sound (a sound with very short duration like a sound of a valve closure) results in the small level by averaging for the long interval, the sound level at the time of valve movement was hidden by the blood flow sound. To find out the detailed change of the sound level, I try further analysis with the integration time of 2 ms and the running step of 1 ms.
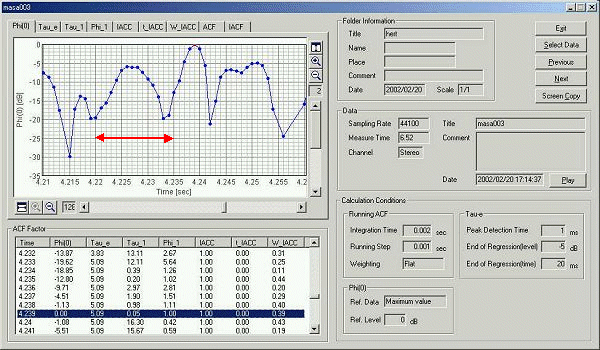
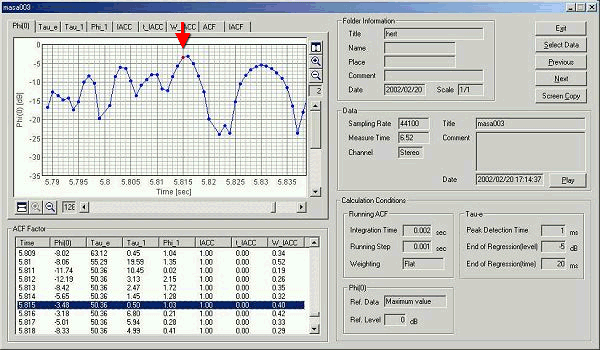
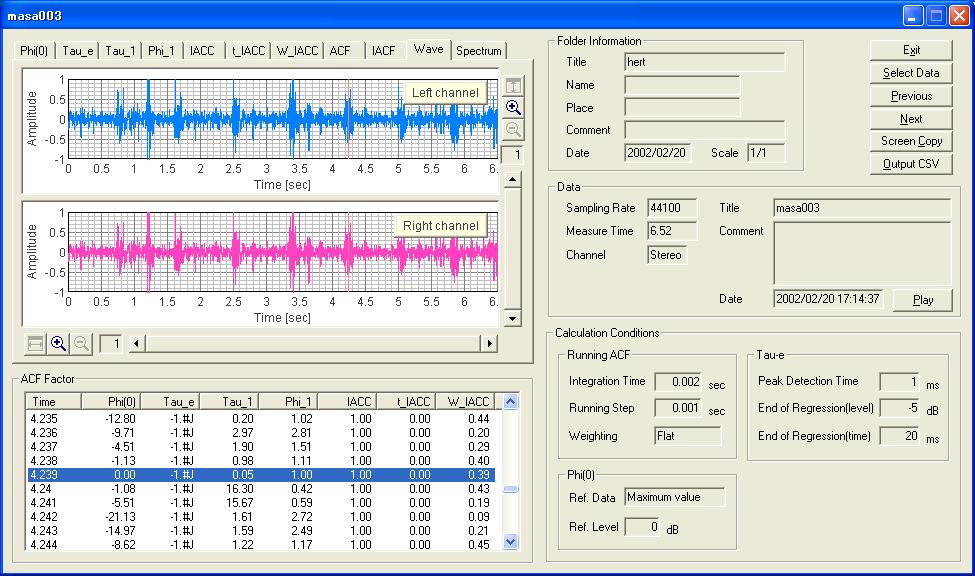
In this calculation condition, 6250 data are obtained from the sound of 6.25 s. Sound level is averaged for 2 ms. Results are shown below. Sound of the mitral valve closure has the maximum level at 4.239 s. Comparing with the previous result, the difference is obvious. Specification of the calculation conditions that highlights the target sound must be necessary for the measurement.
A red point at 4.239 s in the graph below indicates the moment of the mitral valve closure. It can be seen that this sound component is a pulse with duration of 8 ms. Also, before the closure, there is a sound component of 200-300Hz with 15 ms duration between 4.22 and 4.235 s. This seems a sound caused by the blood that is preventing the valve to close. By this analysis, the time taken for a mitral valve to close seems to be a total of 23 ms.
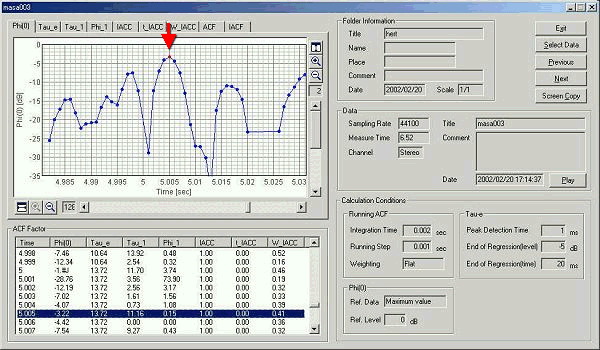
A red point is at 5.005s. It seems slightly before the mitral valve closes. This component has a frequency of 6500 Hz and a duration of 8 ms.
A red point is at 5.815 s. This is also the mitral valve closure sound.
This time, the analysis progressed further. But the movement of the heart valves could not be captured enough. The measurement of the heart beat will be continued. Download a sample sound of heartbeat and try analysis by DSSF3. You can get the same result as this report.
April 2003 by Masatsugu Sakurai
From here, new measurement report written in 2004/07/20
The last analysis with the integration time of 0.002 s and the running step of 0.001 is repeated using the latest version of DSSF3 (ver.5.0.5.6).
The calculation conditions are set as below.
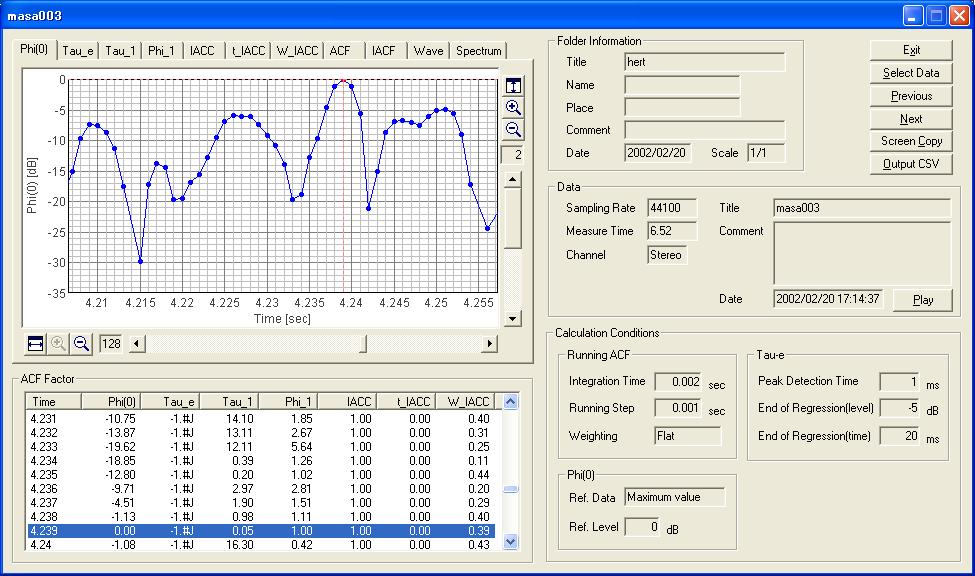
In the next figure, the time course of the sound level is displayed. It is zoomed in to x128. One scale of the graph is 1 ms.
It has been found that a red point at 4.239 s in the graph below indicates the moment of the mitral valve closure. It can be seen that this sound component is a pulse with duration of 8 ms. Also, before the closure, there is a sound component of 200-300Hz with 15 ms duration between 4.22 and 4.235 s. This seems a sound caused by the blood that is preventing the valve to close.
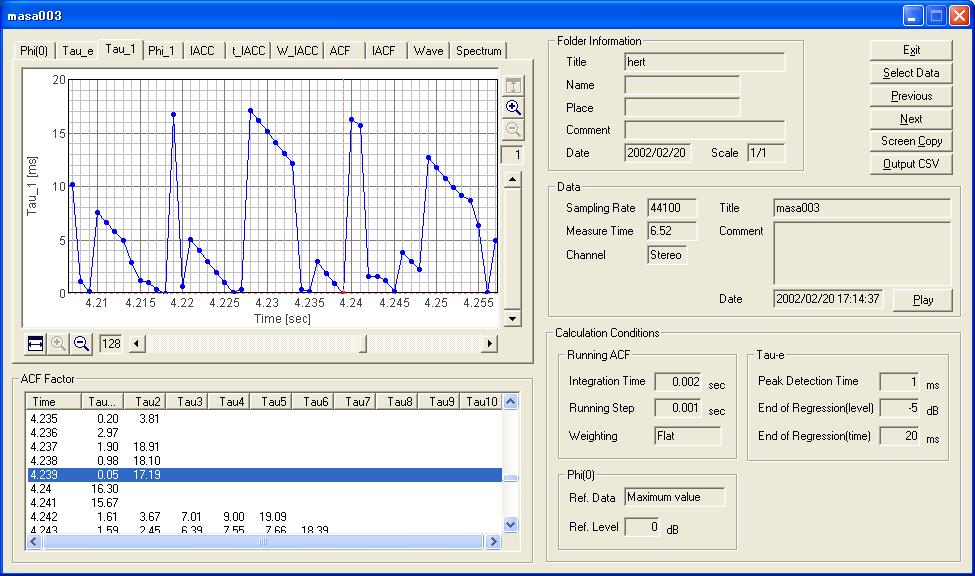
The next figure is the time course of Tau_1 (first peak in the ACF, representing the prominent frequency component). Time scale of the graph is matched with the previous one.
From this result, I can see that something occurs at 4.239 s because the Tau_1 is changed abruptly. To know the reason of this change, I may need higher analysis time resolution.
From the graphs above, the point at 4.239 s was found to be characteristic that has the maximum sound level and the minimum Tau_1. The temporal waveform of sound including at this point is shown below. I can see that the heartbeats occur at about every 800 ms. It corresponds to the heartbeat rate of 75 bpm.
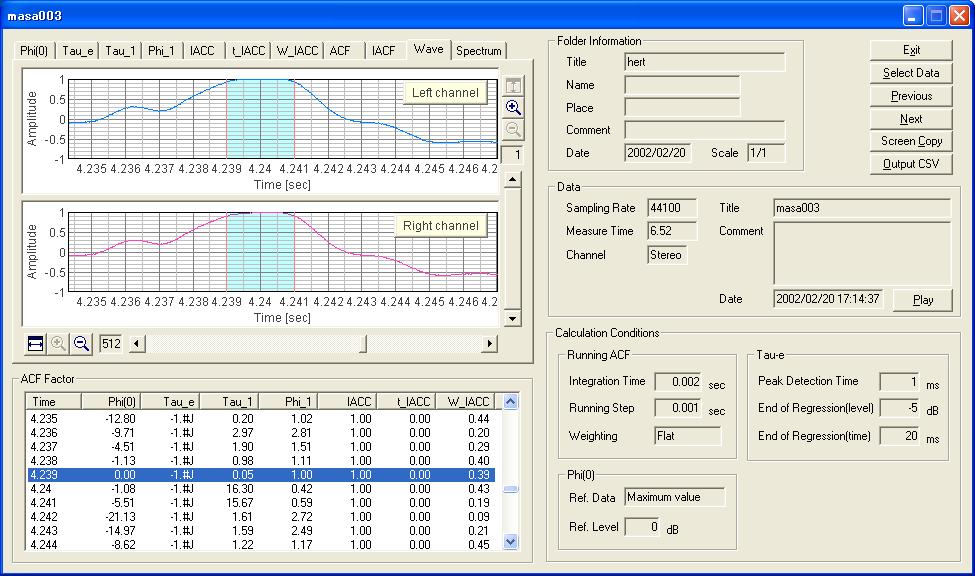
The same waveform is zoomed in to x512 in the figure below. One scale of the graph is 1 ms. The blue area indicates the data portion analyzed. The ACF and the spectrum are calculated for 2 ms data portion in every 1 ms.
The same analysis can be performed on other three valves.
2004/07/20