| Japanese | English |
revised on 2004/07/26
Some of the original report written in April 2003 is replaced by the new results analyzed by using the latest version of DSSF3.
Original report written in April 2003
This time, typical heartbeat examples are analyzed by SA.
The main auscultatory sites of a heartbeat are an aortic area (base right: 2nd right intercostal space), a pulmonary area (base left: 2nd left intercostal space), a tricuspid valve area (4th intercostal space, at lower left sternal border), and a mitral area (apex: 5th left intercostal space, 1 cm medial to midclavicular line).
| S1 and S2 in apex | S1 is best heard at apex. |
| S1 and S2 in base | S2 is best heard at cardiac base. |
| Hyperdynamic S1 | This is a case of mitral stenosis. |
| Attenuated S1 | This is a case of mitral insufficiency. |
| Split S1 | Example of physiological S1 split. |
| Normal split of S2 during respiration | Normally, this split sound is heard on inspiration and becomes single on expiration. |
Right click the above link to save the wave file.
Note: Medical explanation and sound files are thanks to "Online clinical exercise" (in Japanese), which was created to support the medical education.
From here, revised in 2004/07/26
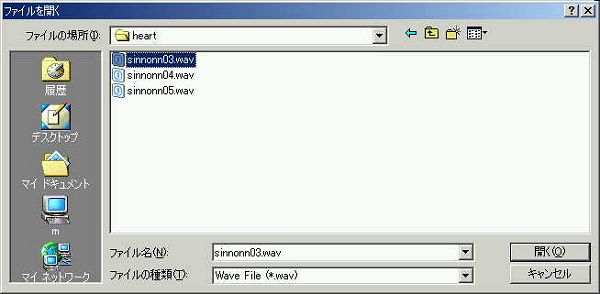
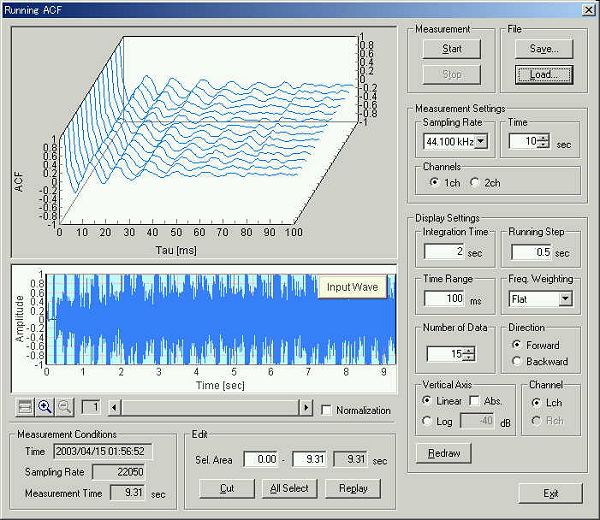
Sound file S1 and S2 in apex was analyzed by DSSF3 version 5. Wave file is loaded from the Running ACF window. Apex is the point at which the first heart sound is mostly audible.
1. Normal heartbeat (S1 and S2 in apex)
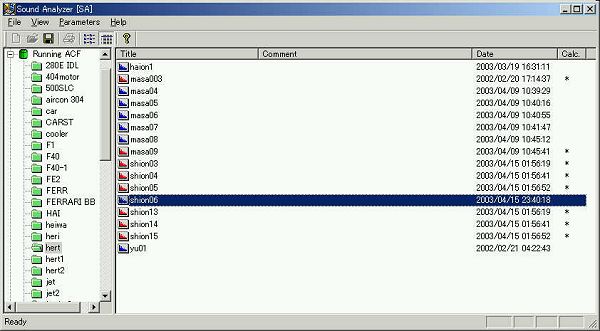
Wave file is loaded.
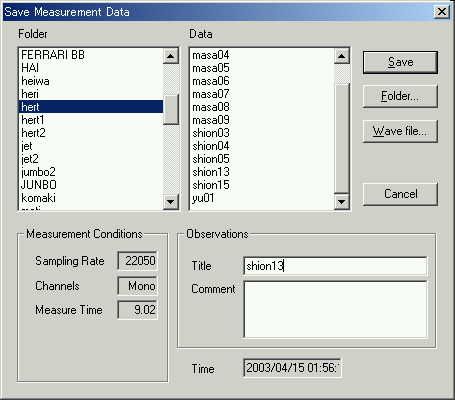
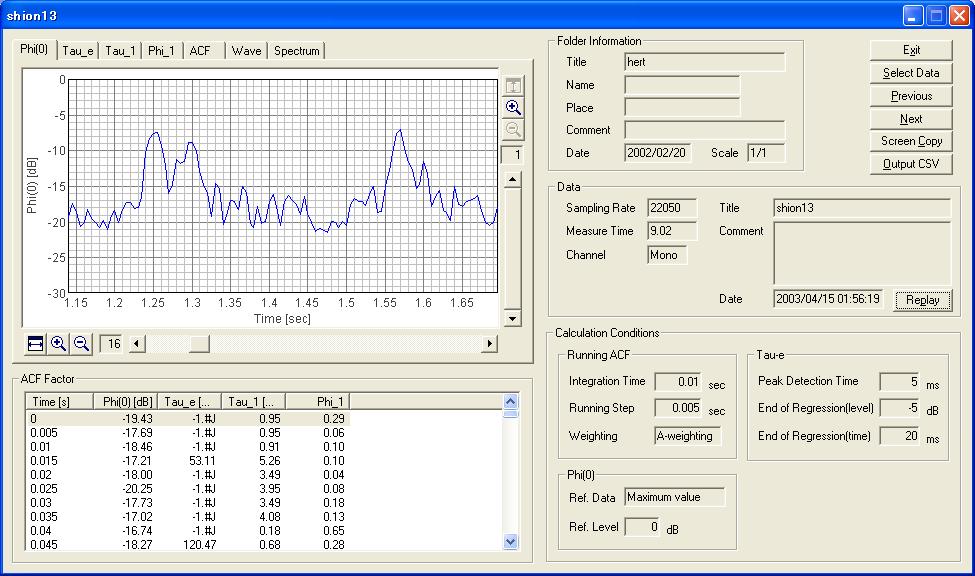
Data is saved as "shion13".
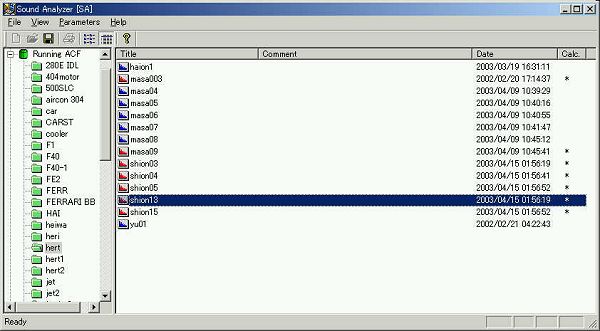
Data is analyzed by SA.
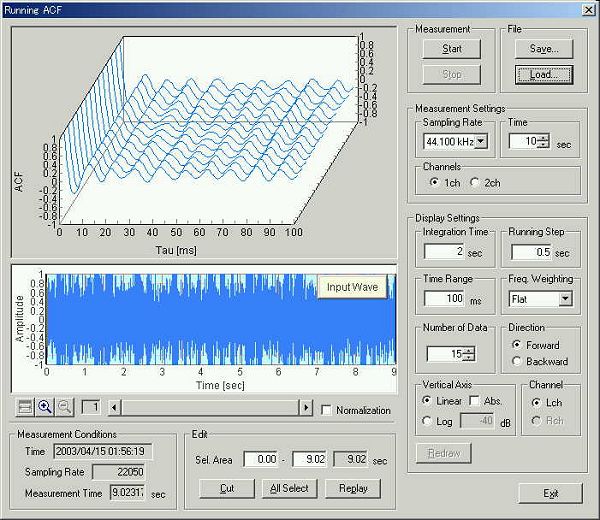
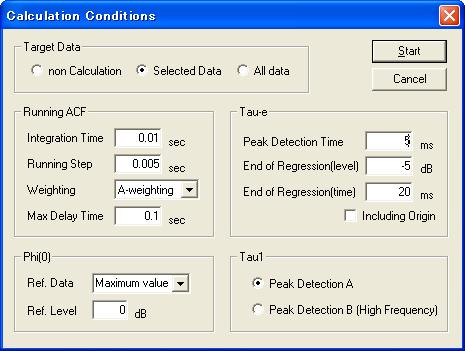
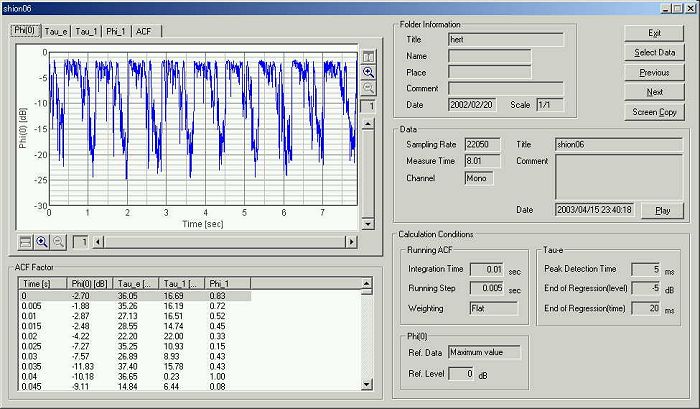
The data is analyzed by the following conditions. The integration time is set to 0.01 s and the running step is set to 0.005 s.
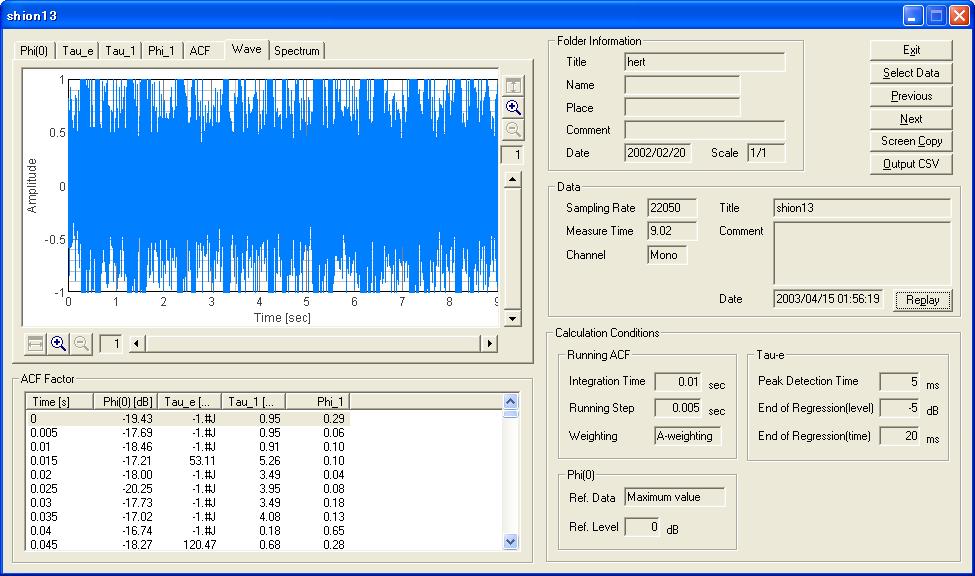
The next figure is the temporal waveform display. The measurement time is 9.02 s, and the sampling rate is 22050 Hz. The recording level seems too high because some of the data is clipped.
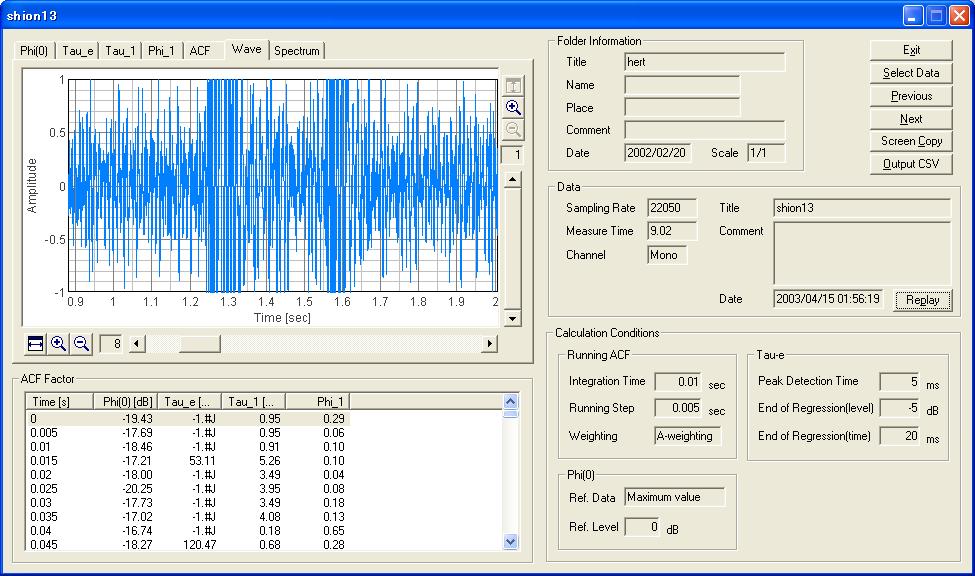
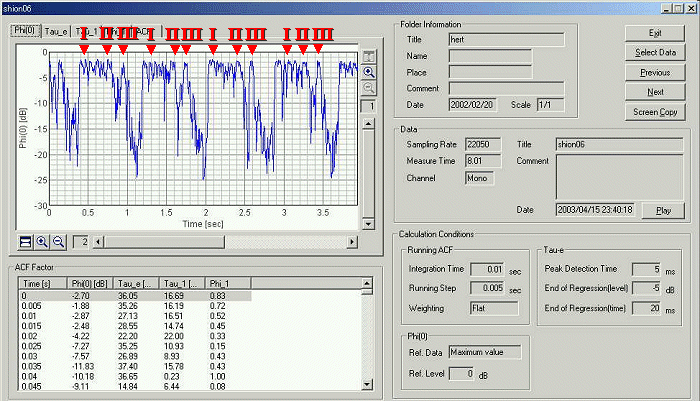
The time axis of the previous graph was zoomed x8. This portion contains the first heart sound and the second heart sound.
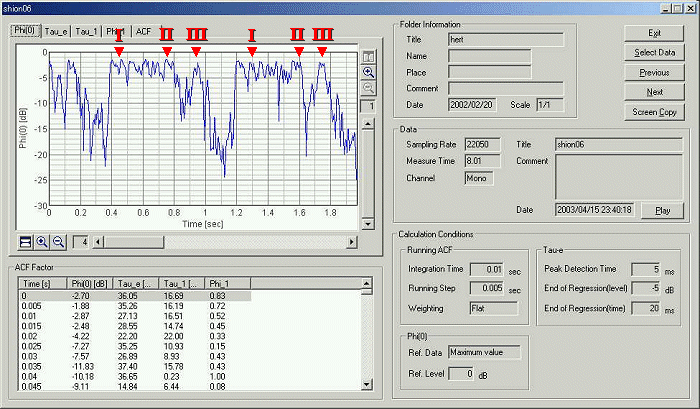
The next figure is the time history of the sound level, calculated by means of the ACF. In this analysis, the sound level is calculated as average values of 10 ms. I can see that the duration of the first heart sound is longer than that of the second sound.
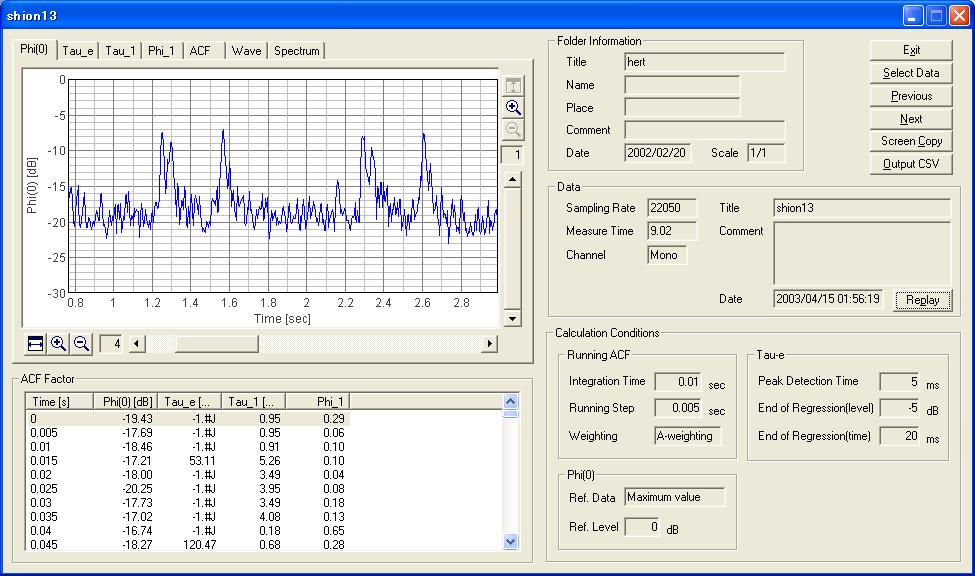
The time axis of the above figure was zoomed x16. I can see the first heart sound and the second heart sound.
2. Normal heartbeat (S1 and S2 in base)
This result is omitted. If you are interested in, try the analysis by following the procedure above. Hereafter, the original report is shown as it was, because the same analysis is available in both the previous version and the latest version of DSSF3.
end of revision in 200407/26
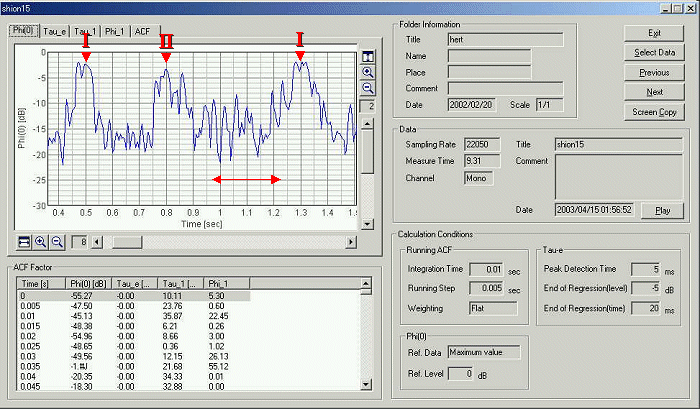
3. Abnormal heartbeat (Hyperdynamic S1)
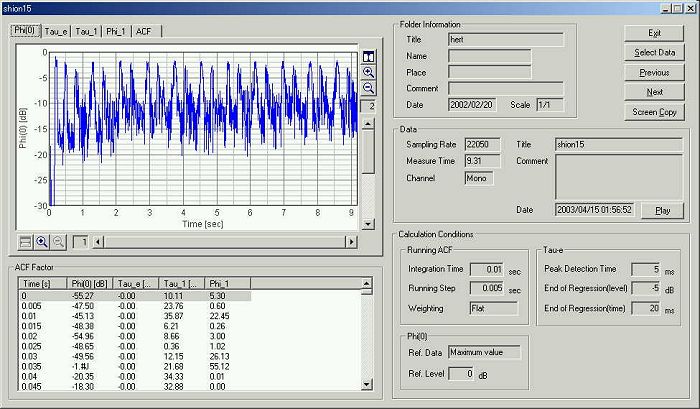
Next, Hyperdynamic S1 is analyzed.
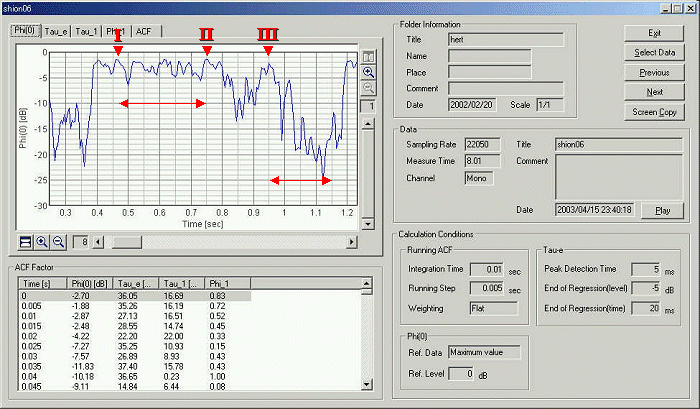
The graph shows time course of the sound level.
The same graph is zoomed up to x4. I and II in the graph indicate S1 and S2.
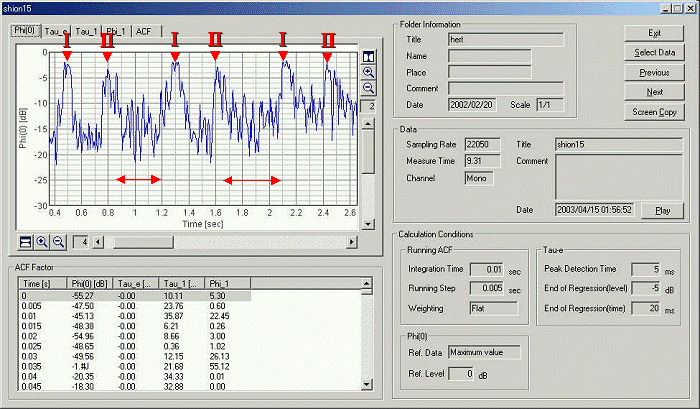
This is a case of mitral stenosis. The characteristics of this abnormal sound are interpreted as follows.
In this illustration, OS shows the valve opening sound (opening snap). Heart murmur follows this sound.
Next, two typical characteristics of heart murmur at the time of mitral stenosis are illustrated.
First is a low pitched and rumbling murmur. This is called Mid-diastolic murmur, and starts after an opening snap.
Second is a high-pitched murmur and is usually only heard as the "absence of silence" in early diastole. This is called Early diastolic murmur.
This is illustrating a case where those two murmur are mixed.
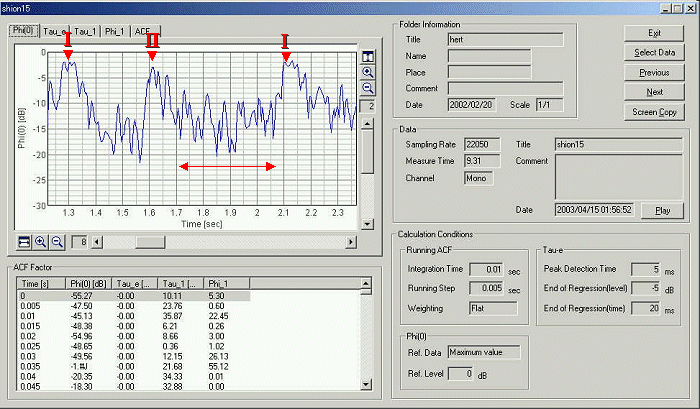
This is a heart murmur measured at the first beat.
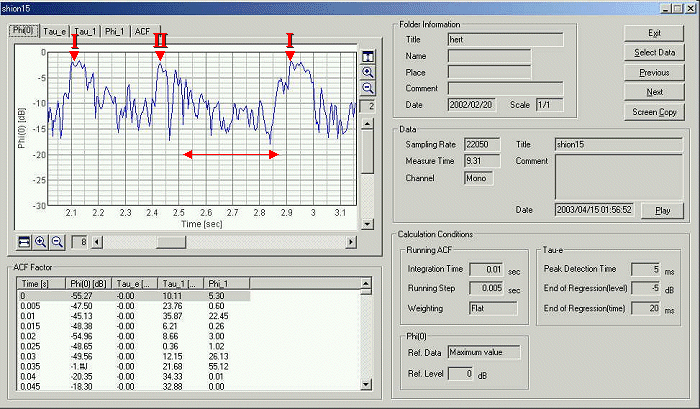
This is a heart murmur measured at the second beat.
This is a heart murmur measured at the third beat. I think that this characteristic murmur can be analyzed in detail by measuring the timing of a valve movement and its acoustical properties as in Heartbeat Measurement 7.
4. Abnormal heartbeat (Attenuated S1)
Next, Attenuated S1 is measured by the running ACF. This is a case of mitral insufficiency.

Data is read by SA.
Time course of the sound level is shown.
The same graph is zoomed up.
It was zoomed up further.
It was zoomed up further to show only one beat. This seems a typical example of Holosysolic murmur as illustrated below.
Two figures illustrate Holosystolic murmur. It begins with the first sound and extends throughout the systolic (contraction) period.
| Reference |
| THE GUIDE to HEART SOUNDS: Normal and Abnormal Donald W.Novey,M.D. Marcia Pencak, R.N.,M.S. John, M.Stang, M.D. ISBN: 084930153X |
April 2003 by Masatsugu Sakurai