| Japanese | English |
| Date | 14 June 2003 2004/12/16 updated |
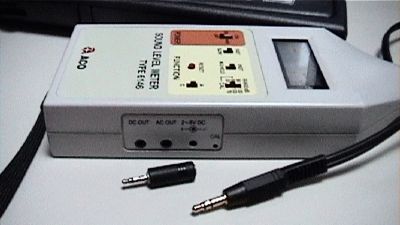
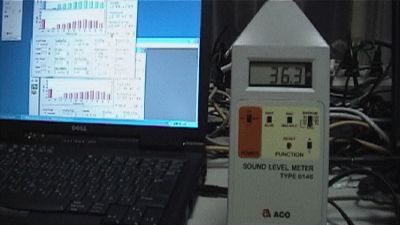
| Sound level meter | ACO SOUND LEVEL METER TYPE 6146 |
| PC | DELL Inspiron 7500 |
| OS | Windows XP Professional |
| Software | DSSF3 version5 |
The sound level meter is capable to measure the sound pressure level (SPL). Recently, a low cost sound level meter can be purchased around 50$. But if we want to store the sound level data or measure the frequency content of noise, high grade level meter is required. The real-time analyzer software significantly extend the function of the standard sound level meter. For example, we can save the measurement results, perform the frequency analysis (octave band analysis), and so.
The sound level meter can be used as a measurement microphone, if it has the AC analog output. Of course, any microphones can be used for the sound measurement. But, it is necessary to use the sound level meter to measure the absolute sound pressure level, because the input level has to be calibrated. How to calibrate the microphone's sensitivity can be found in RA's operation guide.
Connection of PC and sound level meter
To connect the AC output of the sound level meter to PC's line-in terminal, stereo mini jack cable and adapter is used.
Microphone jack of this PC could not be used because the input voltage limit was too small. So, I connected to the line-in jack. If your PC does not have a line-in jack, other sound device with a interface such as USB or PCMCIA is required.
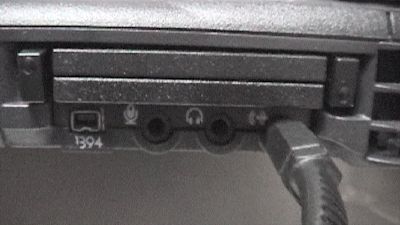
Now, PC and the sound level meter are connected. Captured sound by the level meter is transferred to the PC via D/A (digital-to-analog) converter.
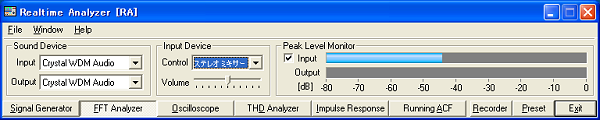
This is Realtime Analyzer's main window. Select "line-in" as an input device and check the input peak level monitor. (Sorry that some of the images below is shown in Japanese.)
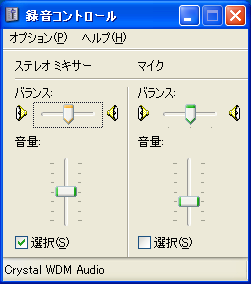
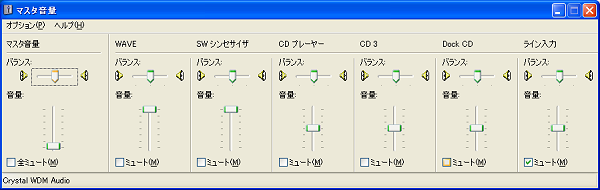
This is the Windows input volume control. When the "line-in" is selected in Realtime Analyzer, line-in (stereo mixer) is also selected in this control.
This is the Windows volume control (output). Unnecessary devices (LINE or MIC) should be mute. If you don't do this setting, howling may occur during the measurement.
Calibration of input level
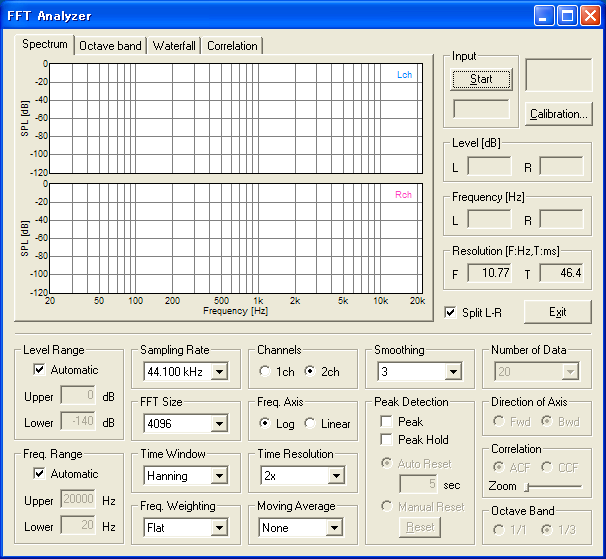
Start the FFT analyzer and click the "Calibration" button.
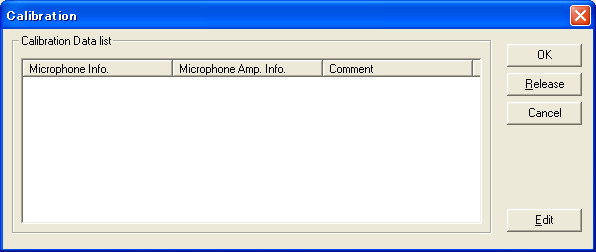
To register the new microphone, click the "Edit" button.
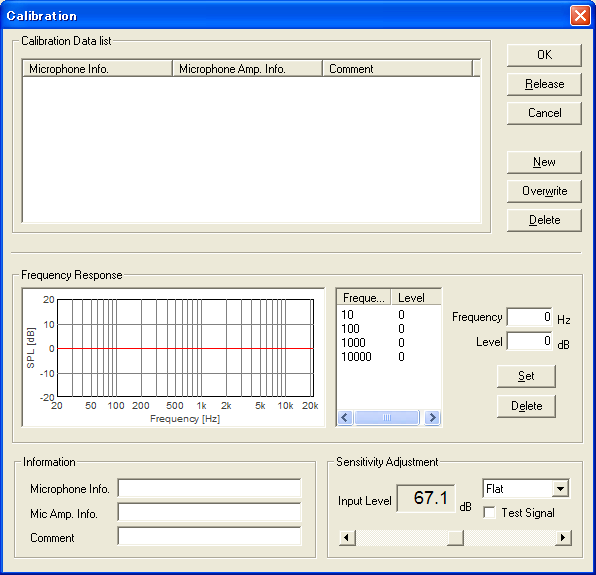
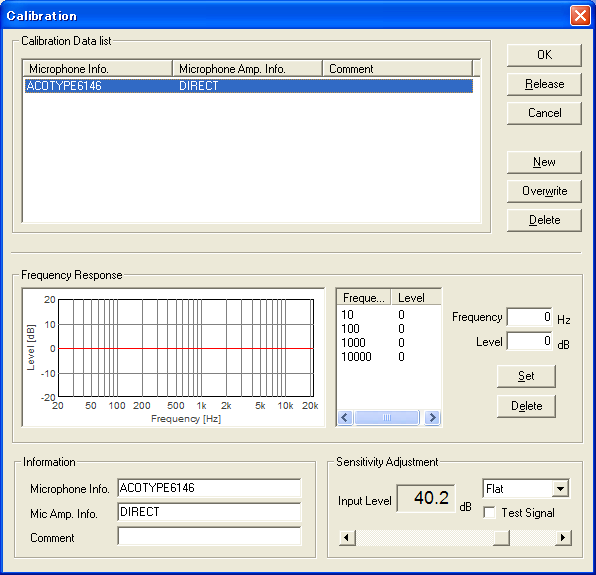
Edit window appears as below. In this window, the input level sensitivity is calibrated.
Measurement range of the sound level meter is set to 30-70dB, time constant is set to FAST, and the measurement mode is set to INST. ACO has two frequency weighting filters, A and C (see the explanation here). When the frequency characteristic of noise is measured, C-weighting is better, because A-weighting reduces low frequency sound too much.
In the calibration window, adjust the input level to the sound level meter. Then save the microphone as ACOTYPE6146. Enter the microphone info and click the "New" button.
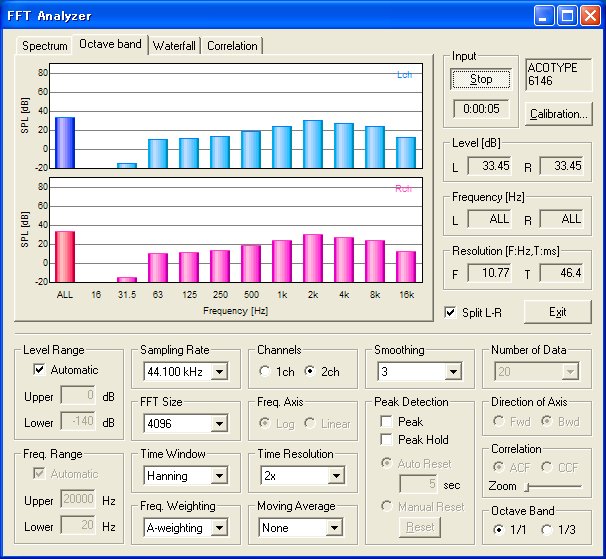
Now, we are ready for the measurement. Octave band analysis is started. Because ACO's output is monaural, same graphs are displayed in two channels. Input signal to the FFT analyzer is already C-filtered in ACO, so the frequency weighting in the FFT analyzer should be FLAT. When the A-weighted sound level is needed, change the setting of the sound level meter to A-weighting.
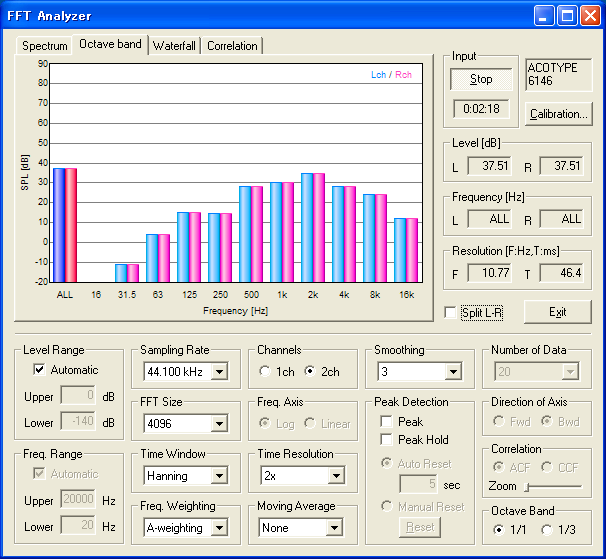
If you release the "Split L-R" check box, two channels are shown on a single display.
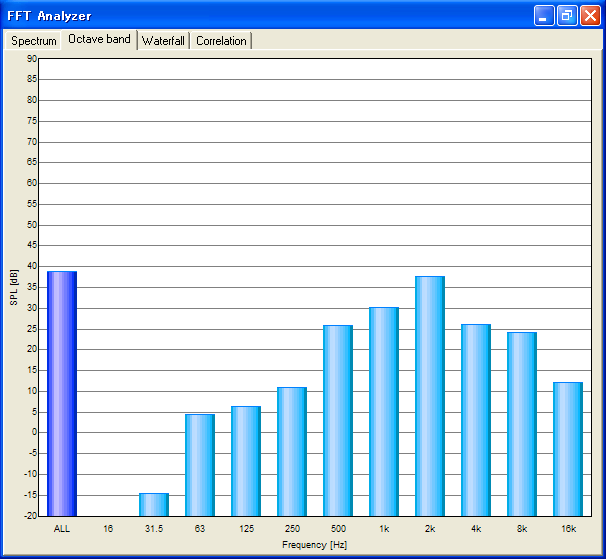
Select 1ch and click the maximize button ![]() .
Graph is maximized. Click ALT and S to start and stop the measurement. Click the
original size button
.
Graph is maximized. Click ALT and S to start and stop the measurement. Click the
original size button ![]() to resize the display.
to resize the display.
News! In DSSF3 ver.5.0.2, data record function has been added to the octave band analyzer. By using this function, the measured sound level in each frequency can be saved as a CSV format. Calculation of Leq (equivalent sound pressure level), Lx (percentile level), or NC value is possible in the other application like Microsoft Excel.
Save octave analysis data
In the octave band analyzer, measured sound pressure levels in all-pass and each octave band frequency can be recorded and exported as a csv format. During the octave band analysis, click the "Data Record" button to open the data recording window.
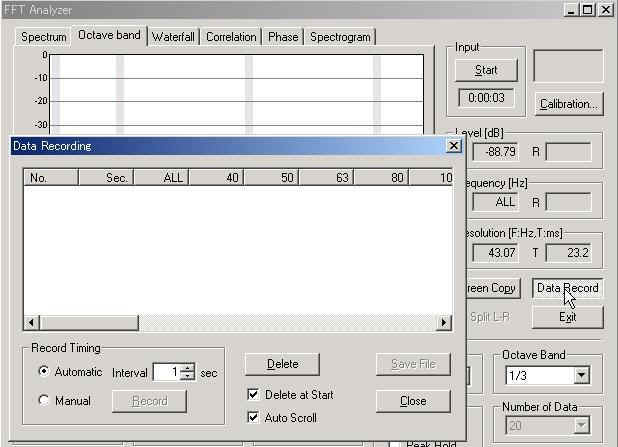
On the Data Recording window, record timing can be selected from automatic and manual. In the automatic mode, data is recorded in every interval. Minimum recording interval is 1 second. In the manual mode, data is recorded when the Record button is clicked.
For example, select the Automatic for record timing and start the measurement in the FFT analyzer. Then the octave band level is recorded automatically.
Recorded data can be save as a CSV format, which is manipulated by other applications like Microsoft Excel. Time history of the sound pressure level, basic statistics (max, min, average, percentile), equivalent sound pressure level (Leq), noise criteria (NC) values can be easily calculated. Some of the examples are shown below. A sample Excel macro for this calculation can be downloaded. noisetest.xls