| Japanese | English |
Lung sound is all sound made within the lungs and the thorax except the sound originating in the heart and a blood vessel system. It consists of respiratory sound and accessory sound. A physiological sound made by the flow of the air in the respiratory tract by breathing is respiratory sound. Accessory sound is an unusual lung sound which is not heard from a normal body.
In this series of measurement report, I will present the analysis of lung sound.
At first, Vesicular sound (wav file) was analyzed by DSSF3 version 5. In DSSF3 version 5, wave files can be read from the Running ACF or Sound Recorder. This time, the running ACF is used.
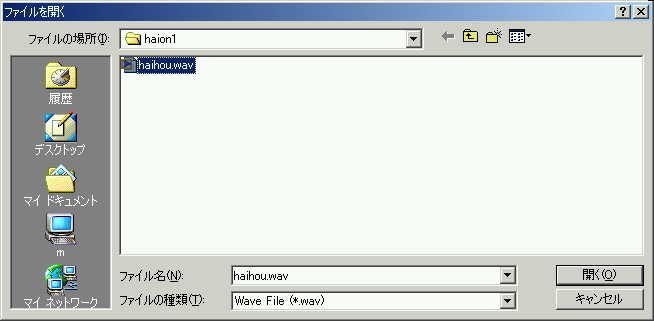
Open the running ACF window and click the "Load" button. File open dialog will appear. Then, specify the wave file to be analyzed.
The wave file was read in the running ACF window. Sampling rate of this file is 8000 Hz. It sounds very loud, but is is a normal lung sound.
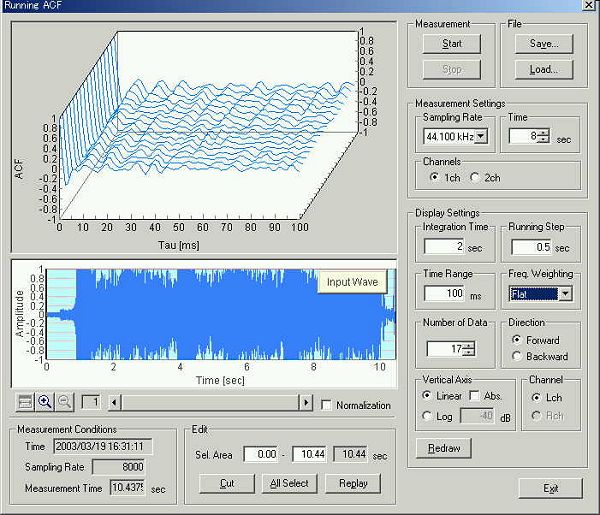
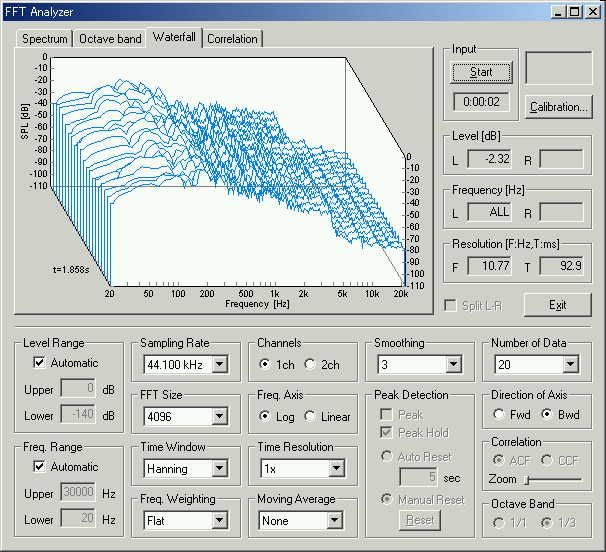
To see the frequency characteristics of lung sound, recorded sound can be replayed and measured by the FFT analyzer. Click the "Replay" button on the Running ACF window and start the FFT analyzer. Because the sampling rate is 8000 Hz, the effective frequency range is below 4000 Hz.
This is the 3D display of the spectrum.
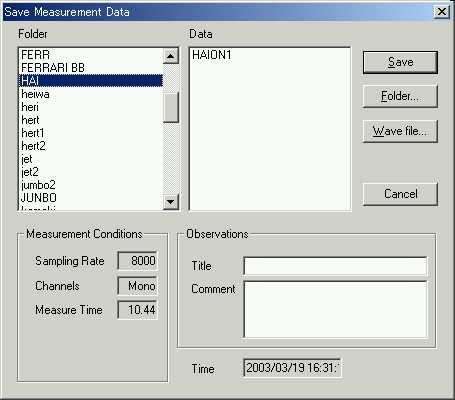
On the Running ACF window, the sound is saved as "HAION1".
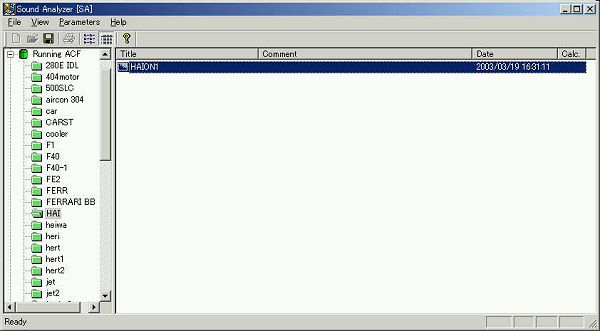
The saved data is analyzed by the Sound Analyzer (SA).
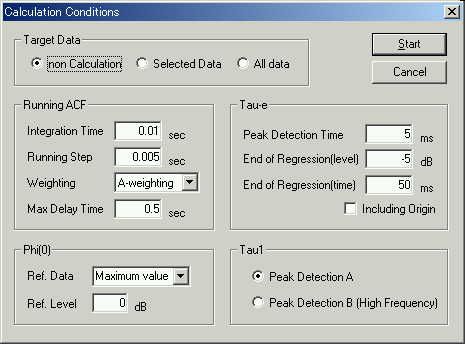
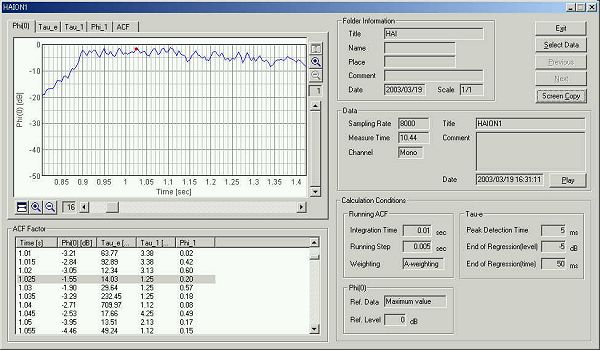
This is the calculation conditions of SA. Integration time and the running step (calculation interval) are set to 0.01 and 0.005 s.
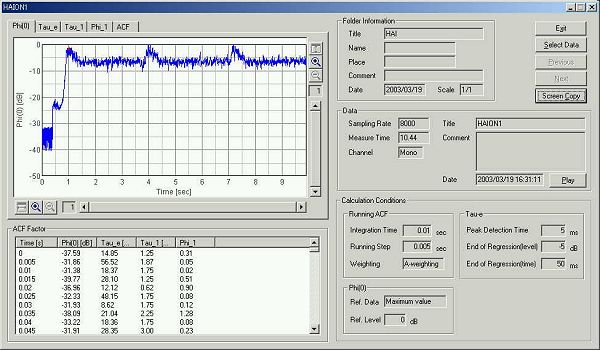
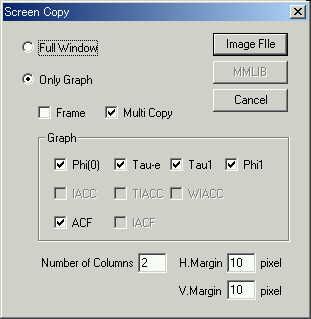
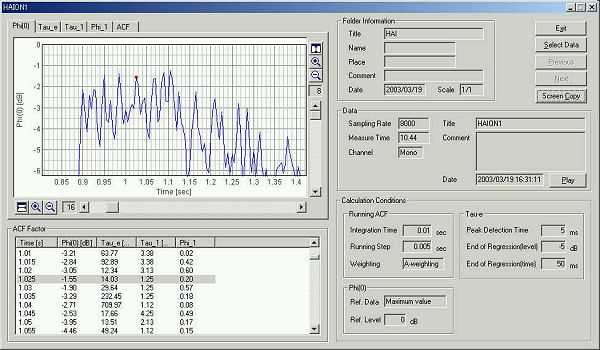
This is the analysis result display. Phi(0) shows the sound level in dB scale. Here, click the "Screen Copy" button to export the graph image.
On the "Screen Copy" dialog, check the graphs to export. In this example, graphs of Phi(0), Tau-e, Tau1, Phi1, and ACF are exported without a frame.
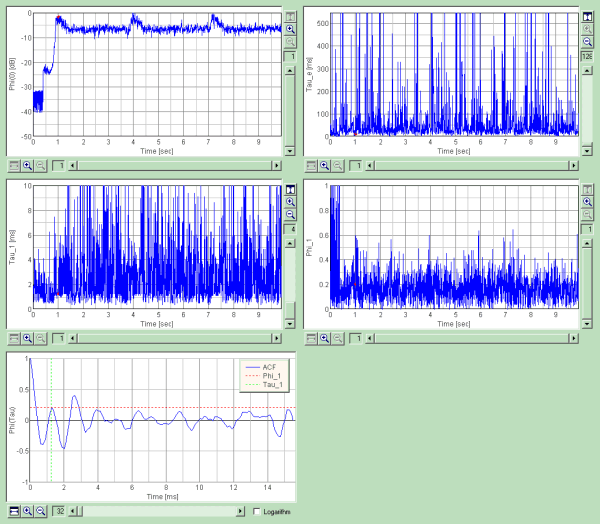
This is the exported graph image. Because the whole data is shown, detailed information is lost. For further analysis, the graph should be zoomed in around the characteristic point.
The previous graphs were zoomed in to the point where the sound level reaches maximum. Zoom size of the graphs are x16 for Phi(0), x64 for Tau-e, and x32 for Phi-1.
Now, let's see the time history of the sound level. In the table of the ACF factor, the values at 1.025 s are highlighted. At this point, Tau_e value is 14.03 ms, Tau_1 is 1.25 ms, and Phi_1 is 0.2. The point where the minimum Tau-e appears is at 1.02 second (Tau_e is 12.34 ms). I assume this point is the feature point of this sound, because the minimum Tau_e represents some kind of dynamic change in the sound. At 1.02 s, Tau_1 is 3.13 ms, which corresponds to 330 Hz of the dominant frequency. Pitch strength is high (Phi_1 = 0.6). Minimum Tau_e appears at 1.05 s too (its value is 13.51 ms). It seems that the change in sound occurs in every 0.025 seconds. After this feature point, pitch of sound becomes around 800-900 Hz (Tau_1 is 1.2-1.1 ms).
The vertical axis of the Phi(0) is zoomed in.
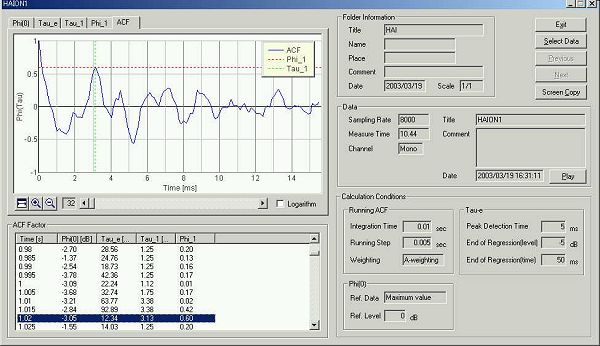
This is the ACF at 1.02 s.
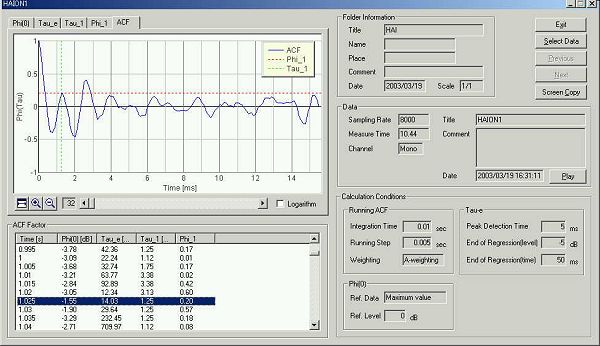
This is the ACF at 1.025 s. It seems that the analysis of lung sound is similar as the speech analysis.
March 2003 by Masatsugu Sakurai