| Japanese | English |
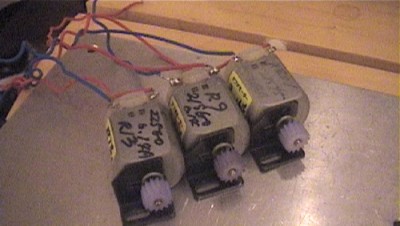
All motors are FC-130S of MABUCHI MOTOR (that is sold for 1/4 slot cars named "rabbit"). Measurement is performed twice for 12 motors.
![]() motor21.wav (44.1kHz / Stereo / 8sec / 1.34MB)
motor21.wav (44.1kHz / Stereo / 8sec / 1.34MB)
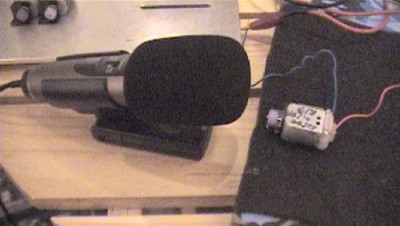
The situation of the measurement. The motor is rotated with
DC12V.
To analyze many data, it is important to record sound at first. Then, the analysis and comparison become easy. The experiment in this page was done as follows. Step by step instruction of the running ACF measurement can be seen here.
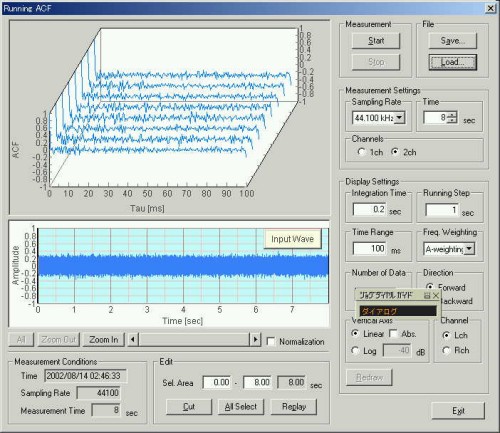
This is the running ACF measurement. It is 20 seconds after starting
operation. Data is saved for further analysis by Sound Analyzer.
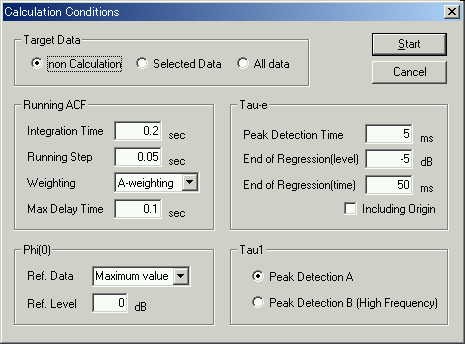
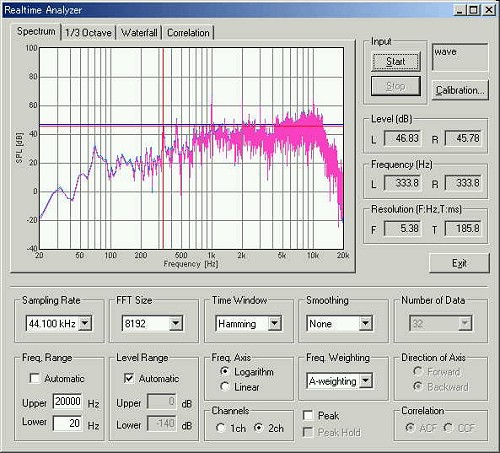
Data is loaded by Sound Analyzer. This is the calculation condition.
These graphs are the analysis results.
See the left-bottom ACF graph. There are periodic peaks every 3 ms. These peaks correspond to the rotational speed of a motor. Its frequency is 333 Hz (1000 ms / 3 ms). When it is translated to the number of rotations for 1 minute, it is 333.8 x 60 = 20,028 rpm. Seeing the ACF in detail, there are small peaks in every 1 ms too. This is perhaps because the motor is of a three-pole design. One rotation completes after the three poles move around. So, the peaks at 3 ms is the highest and is the sign of one rotation.
Other four graphs show acoustic properties of a motor sound. The values of Phi(0) show the time history of the sound energy averaged in 0.2 s (this is set by Integration time). The values of t1 shows the first peak in the ACF (representative frequency), and f1 shows its strength. In the case of pure tone, t1 and f1 correspond to perceived pitch and pitch strength. The te value is the decay rate of the ACF, and it represents the reverberation of the sound. It is the feature of Sound Analyzer to make the comparative analysis of these four acoustic parameters for every time frame.
This is the power spectrum of the same sound. A peak at 333.8 Hz is the
fundamental frequency, that is same as calculated from the ACF.
Analysis results for after two minutes.
As below, twelve motors were measured. There are 24 data because each motor was measured twice. All measurement took
only 30 minutes.
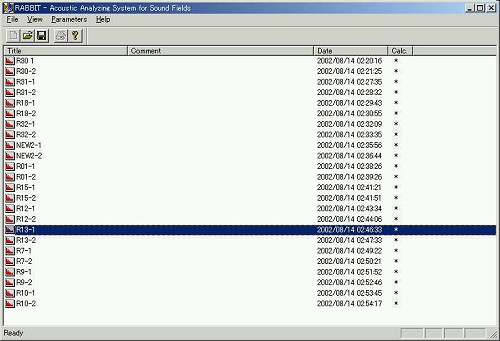
This is the analysis example of the NEW2 motor.
![]() motor22.wav (44.1kHz / Stereo / 8sec / 1.34MB)
motor22.wav (44.1kHz / Stereo / 8sec / 1.34MB)
This is the analysis example of the R9 motor
![]() motor23.wav (44.1kHz / Stereo / 8sec / 1.34MB)
motor23.wav (44.1kHz / Stereo / 8sec / 1.34MB)
It seems that there is an individual difference although we tend to think that the same motor is the same performance. I think the investigation of the motor performance by sound is possible. For example, we can see how is the difference in sound related to the performance of motors.
August 2002 by Masatsugu Sakurai