| Japanese | English |
It is easily converted from 1/3 octave band analysis to 1/1 octave band
analysis. The 1/3 octave band analyzer may be an indispensable item for sound
measurement, even if you only need the 1/1 octave band analysis results.
Figure 1. Test signal is outputted from the signal generator.
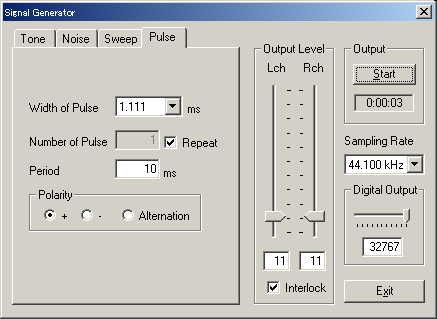
Figure 2. The main window of RA. Peak level monitor is working.
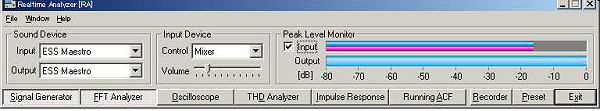
Figure 3. Octave band analyzer window. Now 1/3 octave band analysis is
performed.
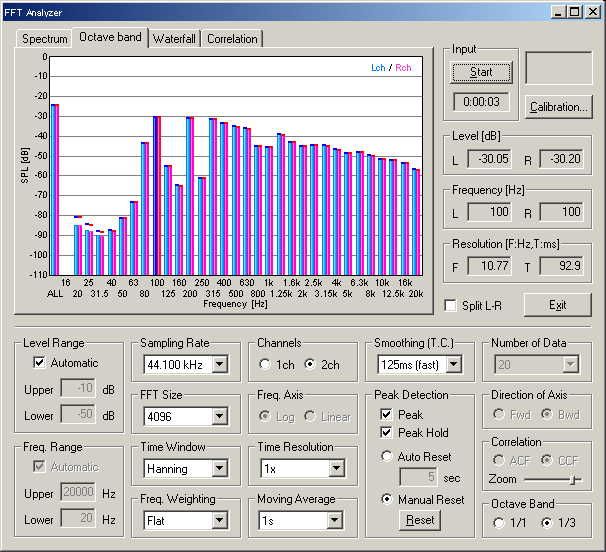
Figure 4. Zoomed in spectrum. Level and frequency range can be set manually.
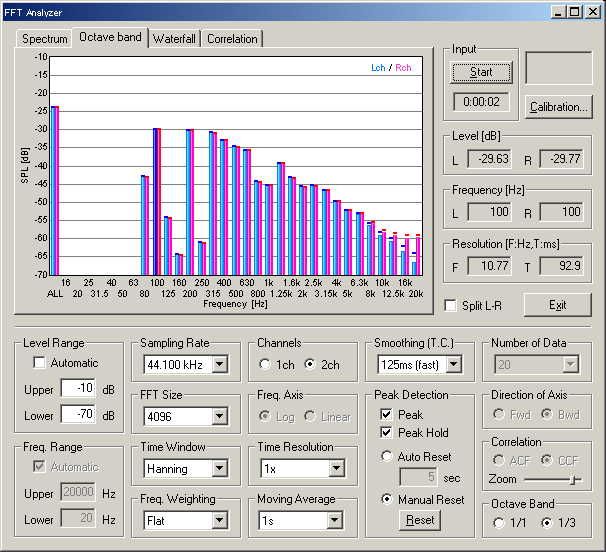
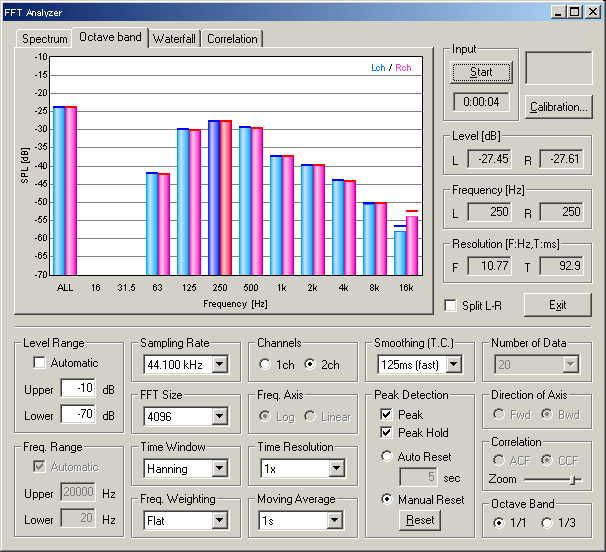
Figure 5. Now 1/1 octave analysis is performed on the same signal. Peak is
found at the center frequency of 250 Hz. Comparing it with 1/3 octave analysis
,the 1/1 octave analysis seems too rough. In Figure 4, the peak is found at 100
Hz, and there a very weak power at 250 Hz (below -60 dB). Considering this, it
might be better to analyze noise, vibration, and a sound insulation performance
in 1/3 octave.
To calculate the sound levels in 1/1 octave from 1/3 octave analysis, add the level of three bands in dB scale. Sound levels measured in dB scale cannot simply be added or subtracted arithmetically. It needs lengthy calculations but can simply be calculated by using the following chart.
Figure 6. Chart for combining sound levels. The difference in dB between the
two levels is found on the horizontal axis and the corresponding correction
appears on the vertical axis. For example, suppose that a1 is 80 dB
and a2 is 74 dB. The difference (a1-a2)
is 6 dB. Looking at the chart, we can see that a difference of 6 dB
corresponding to a correction of 1 dB. Then the total sound level is 81 dB.
Now, the sound level in the 1/1 center frequency of 250 Hz is calculated from the 1/3 octave analysis. Looking at the 1/3 octave analysis (Figure 3), levels at 200, 250, and 315 Hz are -30, -69, and -31 dB, respectively. First, 250 Hz is neglected because it is too small (the difference is 39 dB). The difference between 200 and 315 Hz is 1 dB, so the correction is 2.5 dB from the chart. Total sound level is, -30 dB + 2.5 dB = -27.5 dB. It corresponds to the result of 1/1 octave analyzer (see Figure 5).
July 2003 by Masatsugu Sakurai
Octave band analyzer can be used to analyze the AC analog output of the sound level meter. By using the data record function that has been updated in DSSF3 ver.5.0.2, sound level data in each frequency can be saved as a CSV format. Calculation of Leq (equivalent sound pressure level), Lx (percentile level), or NC value is possible in the other application like Microsoft Excel. See Operation of a Sound-level Meter 2.