| Japanese | English |
Note on 2005/07/13
This report was written in June 2003. At that time, we tested a quality of audio equipments using the signal generator, the FFT analyzer, and the oscilloscope. Such tests are a good exercise for beginners, but sometimes we misread a test result. For example, we misunderstood a normal floor noise of the soundcard as a trouble of the device. In the audio testing, it is important to measure how the test signal and the device's output are different. This is called the distortion. Distortion can't measured by the 1/3 octave analysis. Seeing the sine wave by the oscilloscope or the spectrum analyzer was the only way to measure distortion. But it is a time consuming work if we want to measure in a wide frequency range.
Now, we can use the THD (Total Harmonic Distortion) analyzer in the audio measurement. Using the THD analyzer, we can measure distortion very easily in a wide range of frequency and output level. This tool can be used for checking the quality of the soundcard, audio amplifier, and car stereo systems. Important thing is to know an appropriate volume level in which it does not create distortion in a wide range of frequency.
From here, original report written in 2003
Measurement of the frequency response of PC's sound board by 1/3 octave band analysis
The AD/DA converter of Inspiron 5000e seems to deal with the sampling rate of 88.2 kHz. In RA's sampling rate menu, 88.2 kHz can be selected. However, it did not work correctly for the right channel's input. To investigate this problem, the frequency response of this PC's sound board was measured by RA's signal generator and FFT analyzer.
| Laptop PC | DELL INSPIRON 5000e |
| OS: | Windows 2000 Professional |
| Software | DSSF3 |
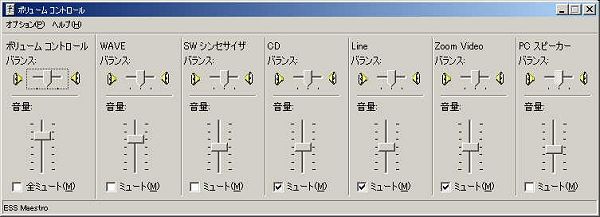
This is Windows playback volume control. Wave output is used by the signal generator. Mute is checked for CD and Line for preventing howling.
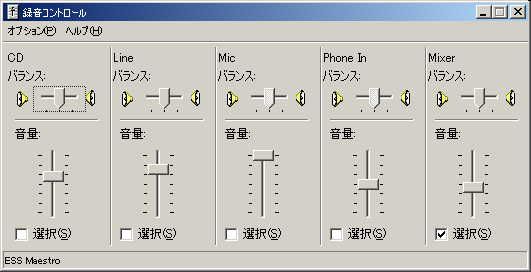
This is Windows recording volume control. This setting is interlocked with RA's input device setting. Now, "Mixer" (Wave/DirectSound) is selected as the input device. In this configuration, quality of the sound card can be measured.
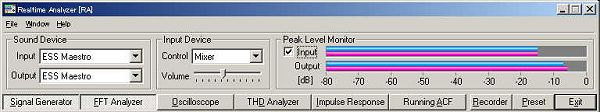
This is the main window of RA. Input volume should be adjusted so that the input peak level monitor does not reach 0dB. Otherwise, the input signal will be clipped and it causes distortion.
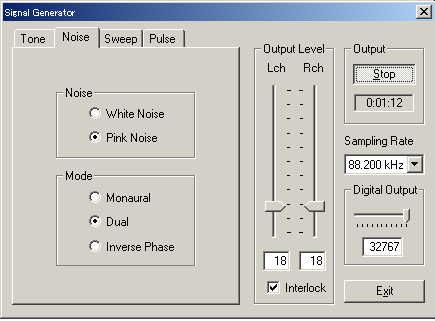
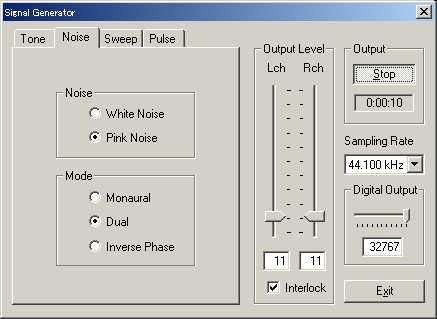
In the signal generator, sampling rate of 88.2 kHz is selected. Start outputting pink noise.
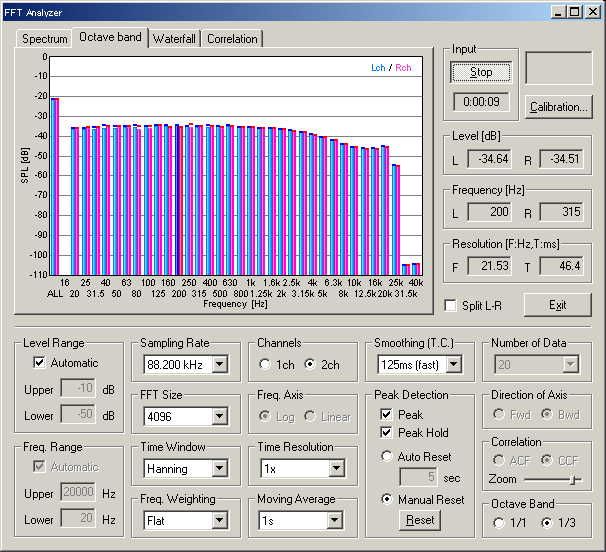
In the FFT analyzer, the frequency response of the soundcard is measured by the 1/3octave band analysis. Now, 88.2 kHz sampling rate is selected also in the FFT analyzer.
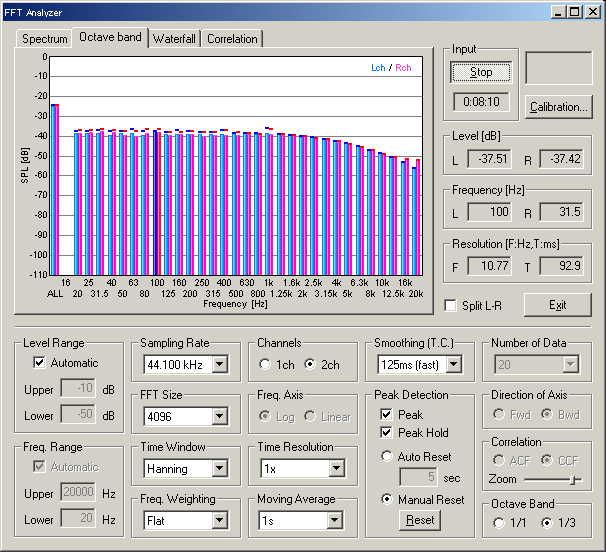
Next, sampling rate is changed to 44.1 kHz (default of Inspiron 5000e) and pink noise is generated.
Similarly, the sampling rate is changed in the FFT analyzer. The 1/3 octave band analysis is performed.
Check of the defect by Sinusoidal tone and the spectrum
By using sinusoidal tone and the spectrum, defect of the sound board such as distortion and hum can be checked.
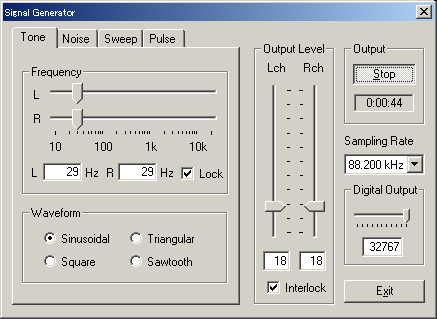
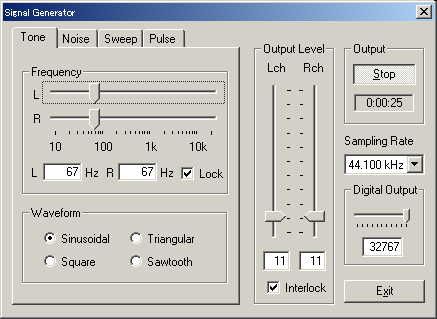
Sinusoidal tone of 29 Hz is outputted.
Power spectrum is displayed. The right channel (pink curve) seems strange. Unwanted frequencies appear.
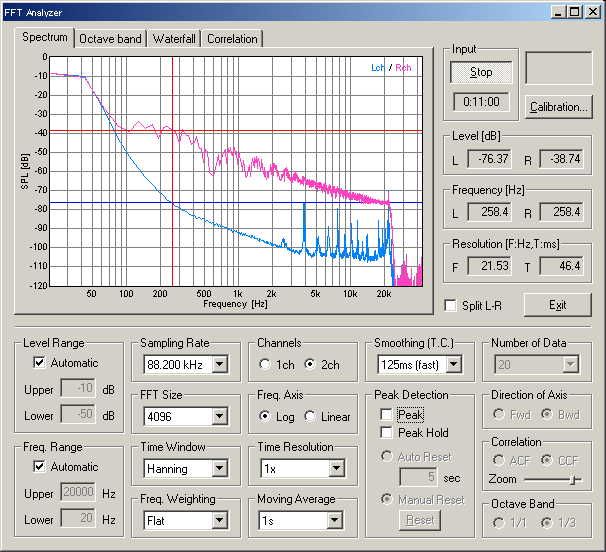
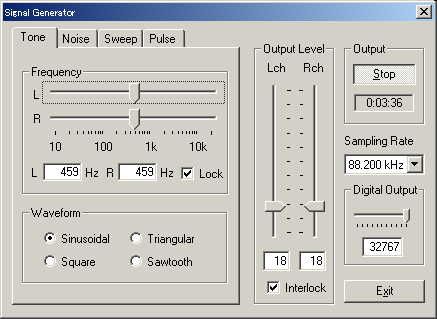
Frequency of sinusoidal is changed to 459 Hz.
Similarly, the power spectrum is displayed. The right channel also seems strange. There are many unwanted frequency components.
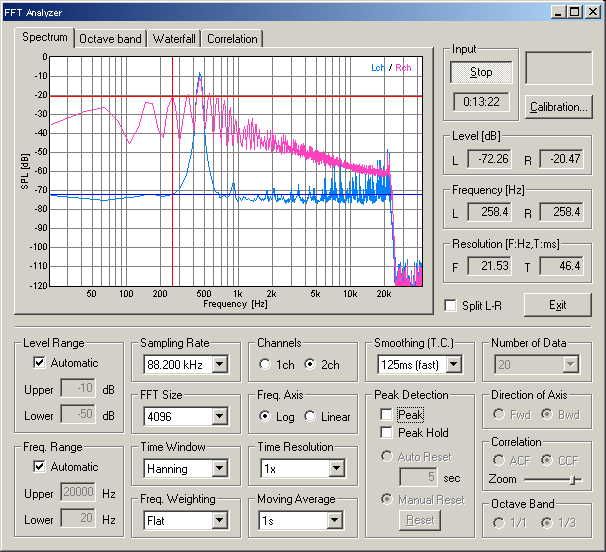
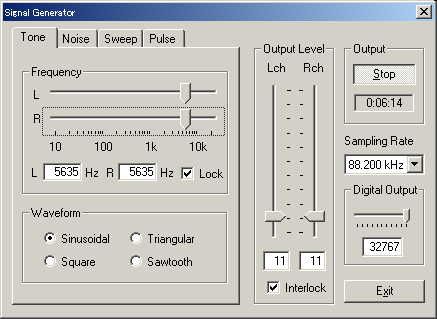
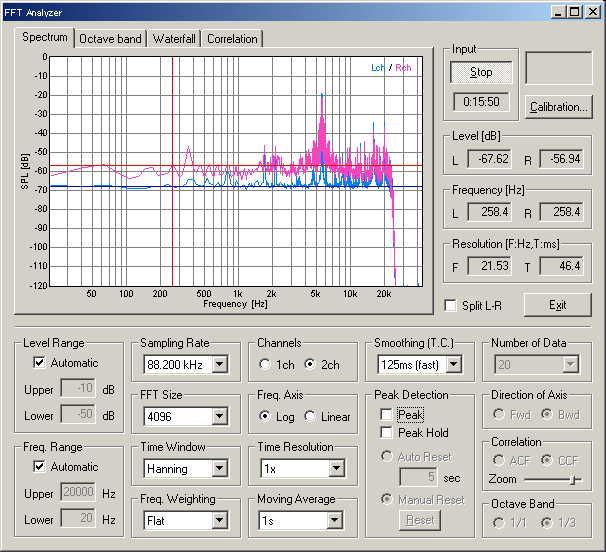
The frequency is changed to 5635 Hz.
The right channel seems to output the distorted signal.
A setting of the sampling frequency seems to be doubtful. It was changed to 44.1 kHz.
Now, it seems normal.
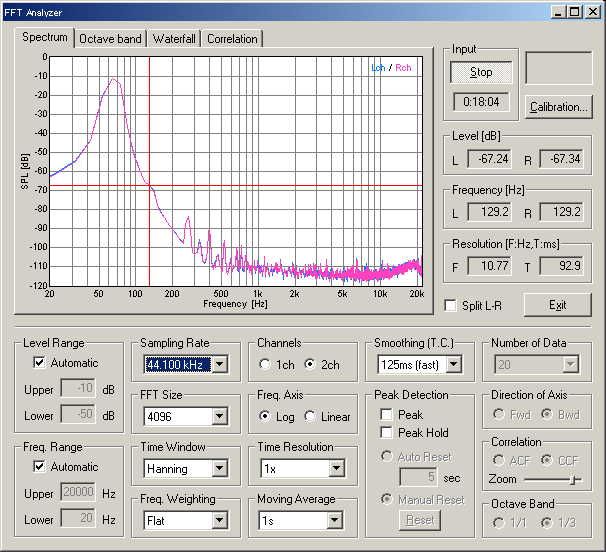
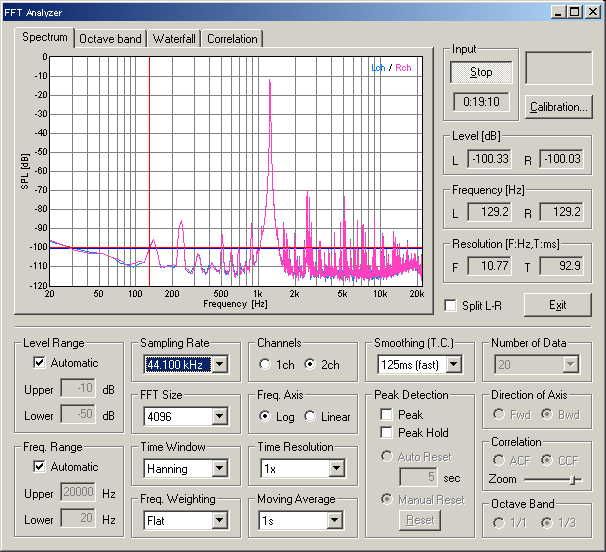
The frequency of sinusoidal was changed to 1264 Hz.
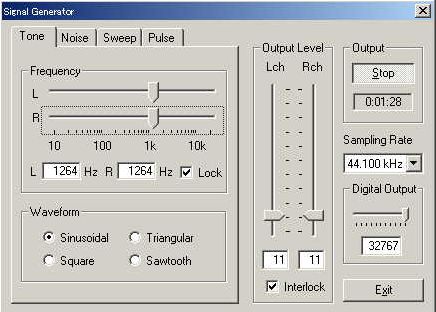
It seems normal too. In the case of Inspiron 5000e, the maker has guaranteed up to 44.1 kHz. So I can't complain even if the 88.2 kHz does not work well. But I wanted the maker to prepare a corresponding analog circuit, since up to 96 kHz is supported after Windows2000. Testing your sound system by manual operation is very important. There is an individual difference in a PC and it is necessary to measure one by one. Also, it is difficult to find such a elementary setting mistake and a defect of a sound board by only the test using pink noise.
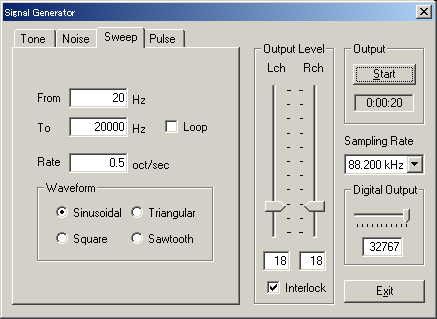
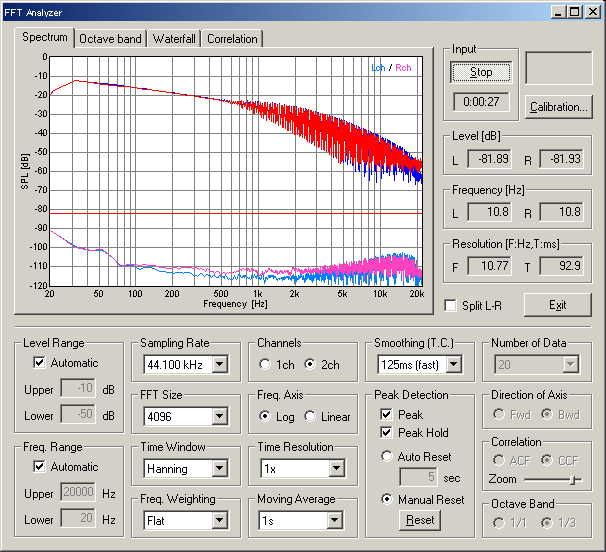
Next, the frequency response of the soundboard is measured by using sine sweep signal and the power spectrum. The sampling rate of 88.2 kHz is selected.
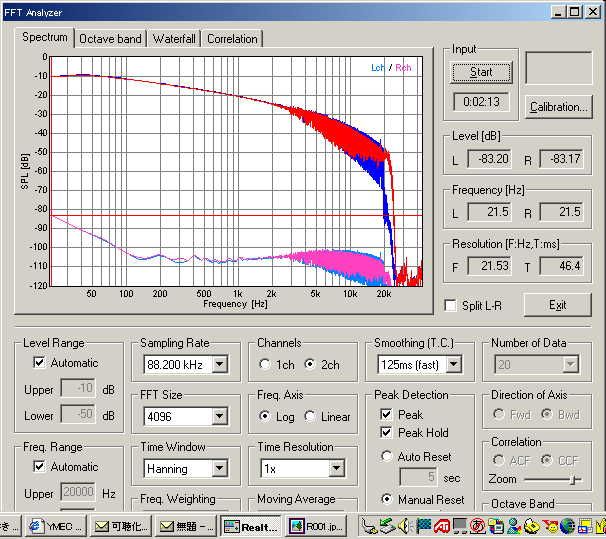
This is the result. By using the peak hold function, the frequency response was measured. It takes a little bit long time because the frequency is changed slowly. The frequency response seems good, but there were unwanted harmonics in many frequency as we have seen above. So, we think the frequency response data shown by the manufacturer isn't sufficient to guarantee the correct operation. Distortion in all frequency has to be small enough.
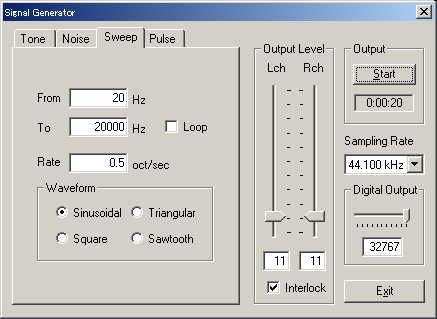
Now, the sampling rate is 44.1 kHz.
This is the result. Similarly, the frequency response was measured by using the peak hold function. It takes a little bit long time because the frequency is changed slowly, but the frequency response can be measured in detail.
Don't feed the low frequency signal to the mid range or high range speakers. It may damage the speaker unit.
June 2003 by Masatsugu Sakurai