| Japanese | English |
Research proposal to JST (Japan Science and Technology Agency). Submitted in May, 2004.
Introduction
It is widely recognized that auscultation is a very effective method in detecting heart diseases and lung diseases in clinical diagnosis, because the auscultation sound contains much useful information about the activity of inner organs such as heartbeat, blood flow, breathing. There is much demand for medical staffs to a device analyzing auscultation sound for helping diagnosis and assessing patient's health condition. In this proposal, we aim to develop the "biomedical sound analyzer" that can analyze auscultation sound in real time to fulfill such requirements.
Background
Previously, we have developed a measurement and analysis system for the environmental noise in cooperation with Prof. Ando, Kobe University. In this system, a new analysis method has been introduced in addition to the traditional sound level meter to assess the effect of noise to subjective annoyance. The analysis uses the correlation technique, and can measure the sound qualities of noise such as pitch and timbre. Based on the measured acoustic parameters and using the template matching, identification of sound is also possible. The software DSSF3 is now sold on the Internet, and is used by many researchers and engineers.
Then, we further investigated the possibility of applying this software in various fields, such as measurements of audio equipments, analysis of voice, diagnosis of motor sound, heartbeat measurement. Report of those experiments is found in our site Introduction to sound measurement. Now we are focusing our attention to the measurement and analysis of auscultation sound. The interest of customers about this field is higher than we expected, and we have received inquiry from many medical institutions. They are seeking the possibility of using the sound measurement software in analysis and diagnosis of auscultation sound.
Recently, we started cooperation with several institutions for acquiring data from the patients. But we keenly realize the limit of the present sound measurement and analysis method when it is used for the auscultation sound analysis. Firstly, it is difficult to capture the important features in the auscultation sound using the conventional frequency analysis. Secondly, the apparatus which can be used easily to perform measurement and analysis in real time, does not exist.
For solving the first problem, we will develop the multiple time resolution analysis. Auscultation sound is a complex signal consists of various time scale fluctuations, from the several ms order impulsive sounds (e.g. heart valve closing sound) to the slowly varying breathing component. To capture such greatly different time scale signals simultaneously, we combine the high temporal resolution / short time analysis and the low temporal resolution / long time analysis.
As for the second problem, conventional methods like the electrocardiogram (ECG) and the phonocardiography (PCG) are mainly used only to check a disorder of waveforms by seeing the recorded signals. To acquire still more detailed information from these signals, it is necessary to analyze the data recorded on the occasion of medical examination. This takes time and effort very much. Moreover, it is difficult to examine sound with different condition, such as listening point and a patient's posture in real time. In recent years, some software is available which automatically analyze these signals. But usually the users have to do a detailed setup of the analysis time window and the analysis frequency range before the measurement. If these settings were not correct, most useful information could not be captured. In this project, we develop an algorithm that automatically adjust the measurement conditions (analysis time window length, frequency range, and resolution) based on the signals time scale. It would help users to perform correct measurements easily in a limited consultation hours.
Work plan
In this project, to solve the problems, the sound analysis technology
developed so far is examined and the still newer analysis technology is
developed.
1. Analysis of multiple time scale signals
Auscultation sound is a complex signal consists of various time scale fluctuations, from the several ms order impulsive sounds (e.g. heart valve closing sound) to the slowly varying breathing component. To capture such greatly different time scale signals simultaneously, we combine the high temporal resolution / short time analysis and the low temporal resolution / long time analysis.
In Figure 1, an example of the heart sound analysis is shown. The heart sound was recorded from a healthy male subject using a stethoscope microphone with the sampling rate of 44100 Hz. Different information can be obtained from the same data if it is analyzed with different time range. First, the analysis with short time range and high temporal resolution reveals the detailed information of heart valve closing sound. In Figure 1, left, heart sound was analyzed with the time range of 0.1 s. We can see that the closing sounds caused by the different valves are clearly separated. Detailed qualities of each valve closure, such as sound level, pitch, pitch strength are also analyzed. Those information are extracted in real time, and can be used for detecting abnormality.
Second, by the analysis with long time range and low temporal resolution, real time monitoring of heart condition (e.g. heartbeat rate and its degree of regularity) would be possible. The right of Figure 1 shows a sound pressure waveform, which was calculated from the down sampled heart sound data with the time range of 1.0 s. Although a detailed waveform like before is not obtained, the information about the heartbeat rate and its fluctuation is fully included. If the autocorrelation function is calculated for this waveform, it is possible to detect the periodic peak equivalent to a heartbeat rate. By plotting the time series of the period (heartbeat rate) and the amplitude of the peak (degree of regularity in heartbeat rate) in the autocorrelation functions, we can see whether or not the heart is working with a regular rhythm in real time.
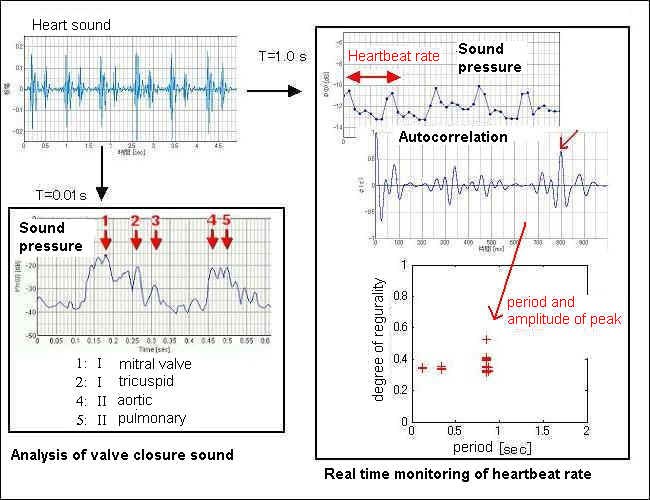
Figure 1. Analysis example of heart sound
2. Automatic adjustment of measurement conditions
As explained before, appropriate setting of analysis time range, frequency range, or temporal resolution, according to the kind of information to be measured, is necessary to analyze the auscultation sound correctly. But the previous measurement system (software or hardware) forces the users to adjust these parameters manually. This is a complicated operation for some users, so they might measure sound with the wrong settings. We develop an algorithm that automatically adjust the measurement conditions (analysis time window length, frequency range, and resolution) based on the signals time scale. It would help users to perform correct measurements easily in a limited consultation hours.
3. Analysis of acoustic parameters corresponding to human hearing
Conventional sound analysis is mainly based on the spectral analysis. But the spectrum does not always capture all the sound quality that we hear. We analyze sound by using the autocorrelation and cross-correlation functions. By these analysis, sound qualities like loudness, pitch, reverberation, and spatial information of sound source like localization, can be analyzed in detail.
Figure 2 shows an analysis example of heart sound recorded from a patient of which heart valve has been replaced to the artificial mechanical valve. Data was analyzed by the power spectrum (top) and the autocorrelation function (bottom). The artificial valve sound usually contains much high frequency component. It sounds tick tock like a wristwatch. However, the volume and the timbre of this sound greatly differ between patients even with the same kind of valve. It is probable that the difference of sound qualities reflects the patient's health condition or the valve's functional condition.
Here, we show two valves with and without high tone sound. The right one clearly had a clear and high pitched sound. The left one had a vague and low pitched sound. However, we cannot see this difference from the spectra. On the other hand, the autocorrelation functions have a significant difference in its period and the height of the peaks. The period of the autocorrelation function corresponds to the pitch of sound. The shorter the period of the autocorrelation, the higher the pitch of sound. The amplitude of the peak in the autocorrelation corresponds to the clarity (or strength) of pitch. We can see that the right one has clear and higher pitch.
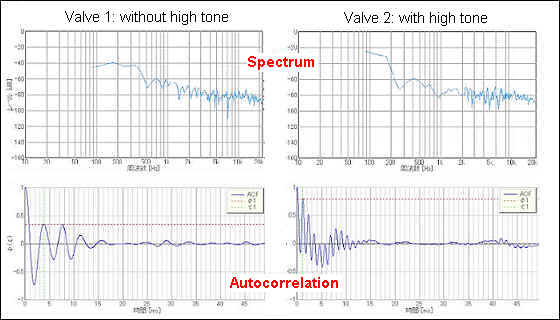
Figure 2. Analysis examples of artificial valve sounds
In the project, it is planned that the new analysis methods described will be implemented in DSSF3. Those new functions will be tested in several medical institutions for further improvement.