| Japanese | English |
revised on 2004/07/19
This measurement was first done in February 2002. I focused on the evaluation of closing sound of heart valve, by using DSSF3 ver.3, that is now sold as RAE version 2 since 2003/02. The report was rewritten in April 2003.
At the times of the first measurement, Sound Analyzer did not have the high time resolution FFT analyzer that works with the ACF analysis. So, I estimated those frequencies by using the real time spectrum analyzer and the running ACF graphs separately. However, it took much time, and the time constant for the measurement might not be suitable for the heartbeat analysis. Since the FFT was performed on an arbitrary portion in the recording, it was lacking in reproducibility. These limitations did not allow me to investigate the heartbeat appropriately. To overcome these limitations, DSSF3 has been improved on July 2003. In the current version of DSSF3, the FFT analysis and the ACF analysis can be performed on exactly the same data. So, I decided to analyze the same data again. The results of the new analysis are reported in this page after the original report.
Original report written in 2003
I introduce the measurement of heartbeat sound as one of the application of our measurement software.
It is said that various sound will be mixed in the heart sound if a patient have some disease. Heartbeat will be clear and intelligible, if you are healthy. Note that breath should be stopped during measurement. Also, the measurement is difficult when you are hungry, because the belly sound becomes loud and disturbs. Much other information about auscultation can be found on the Internet, so I will omit details.
1st Measurement
| Date | 20 Feb. 2002 |
| Place | Home |
| Subject | 50 years old man |
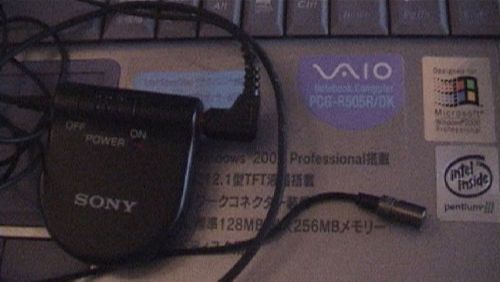
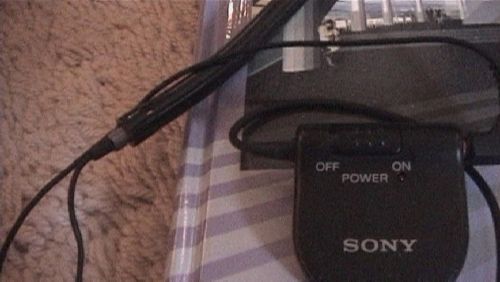
| Microphone | SONY ECM-T150 Electric Condenser Microphone |
| Microphone size | diameter: 6mm, length: 12mm |
| Video camera | SONY DCR-PC1 |
| Personal computer | SONY VAIO PCG-R505R/DK |
| OS | Windows2000 Professional |
| Software for measurement | DSSF3 (Full System Version) |
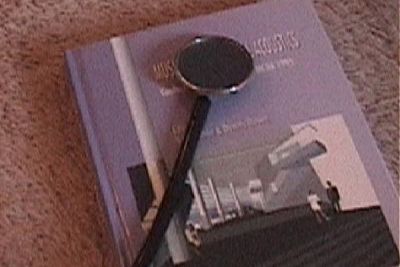
| Other | Stethoscope |
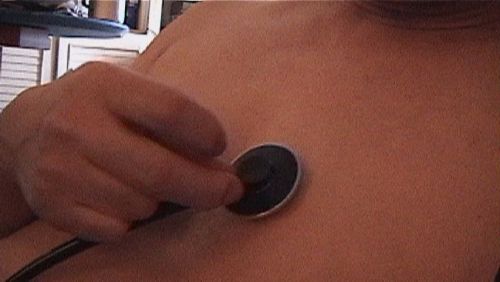
The tube of a stethoscope with 4-5 mm inner diameter was cut in length of 15cm, and a small condenser microphone (8000 yen, SONY) was inserted.
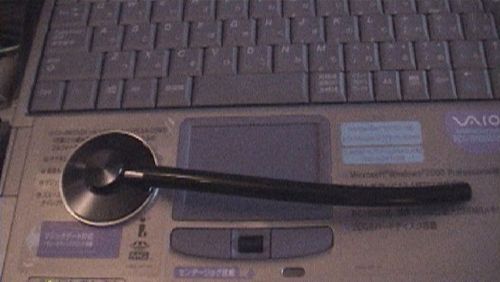
The microphone is fixed in the nylon tube.
Now, heartbeat is recorded. Stethoscope is placed on the breast softly. Because the microphone is inserted in the rubber tube. Noise becomes loud if I touch the tube.
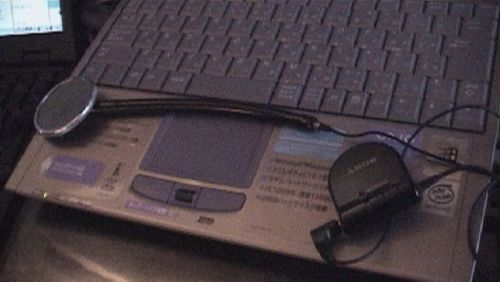
At the first time, I tried a simple method as a preliminary measurement. The microphone's signal is connected to the digital video camera, and the sound is recorded with a motion picture on the videotape with a 44.1kHz sampling and a 16-bit resolution.
It seems that the frequency range of the heartbeat is low. So I thought I should lower the sampling rate to cut out the high frequency sound. But I decided to record the full frequency range as usual, because this is a first try. After some practice, I could record a clear sound.
Data was transferred from the video camera to the notebook PC via iLINK.
This is Windows' volume control. Output device other than Wave must be mute.
Similarly recording volume is adjusted.
Measurement at the time of a non-signal
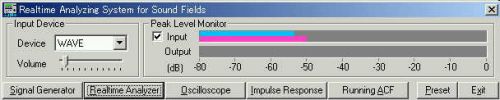
Peak level meter display is shown. Make sure that the input level is not overload.
Real-time display of the 1/3 Octave analysis. Background noise has almost flat frequency response.
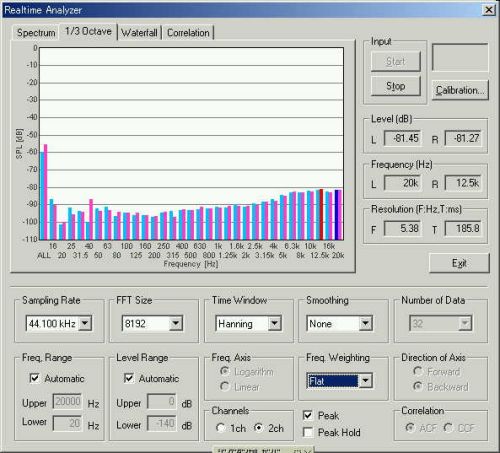
It seems that the measurement environment is good.
Heartbeat sound measurement
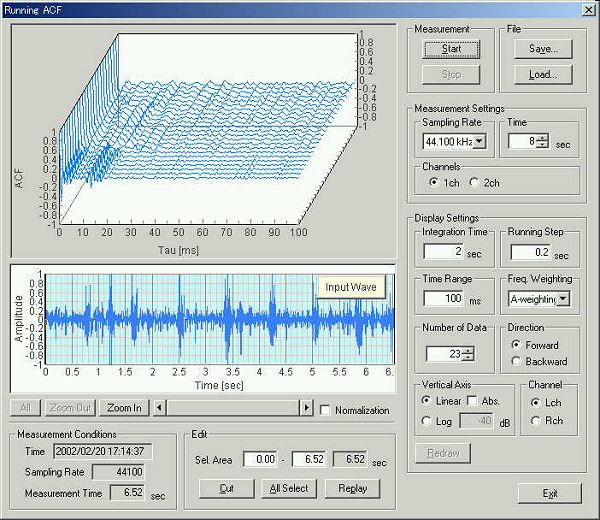
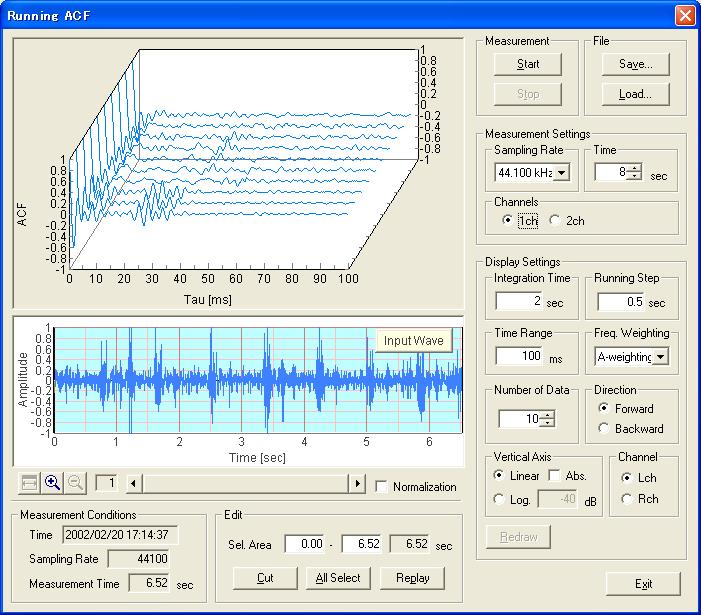
Running ACF measurement of the data for about 6.5 seconds was performed. Below is the screen of the running ACF measurement. Above graph is a 3D display of the ACF. Bottom is a input waveform of the recorded heart sound.
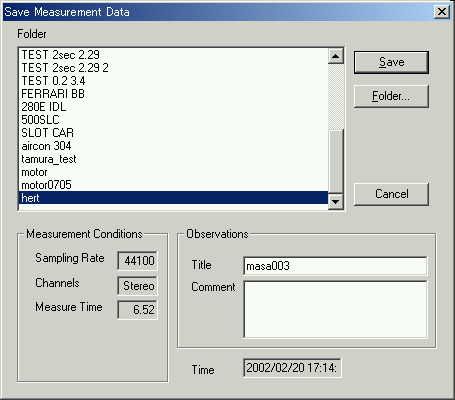
Data was saved in order to apply to the following analysis by the SA (Sound Analyzer).
You can listen to a heart sound.
![]() heart1.wav (1.09MB)
heart1.wav (1.09MB)
Below is the analysis window of the Sound Analyzer. In this measurement, first sound at 4.2 s and second sound at 4.5 s, and the next first sound at 5 s and second sound at 5.3 seconds are clearly recorded.
The first heart sound is heard at the early stage of contraction. Usually, the interval of first sound and second sound is short, and the interval of second sound and next first sound becomes long. Analysis continues to the next report.
| 1st | Closing sound of a mitral valve and a tricuspid valve. Early stage of contraction. |
| 2nd | Closing sound of an aortic valve and a pulmonary valve. The end of contraction. |
| 3rd | It is often heard in the state of heart failure. It may be heard for the healthy youth. |
| 4th | Heard over apex; while patient is at at supine or left semilateral position. |
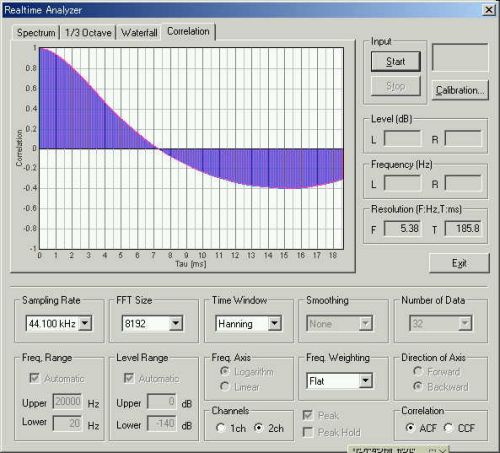
This is the real-time autocorrelation function of heartbeat. It was measured by the Realtime Analyzer, while the sound was replayed on the Sound Analyzer.
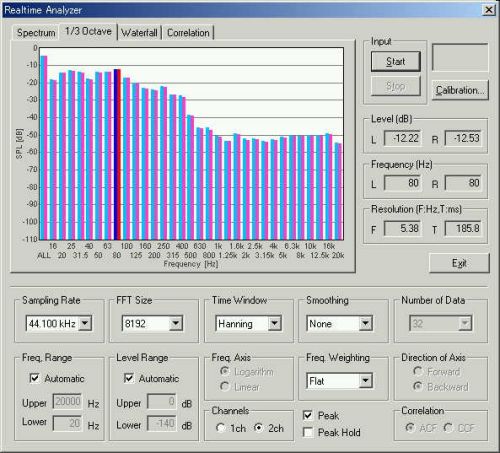
1/3 octave analysis
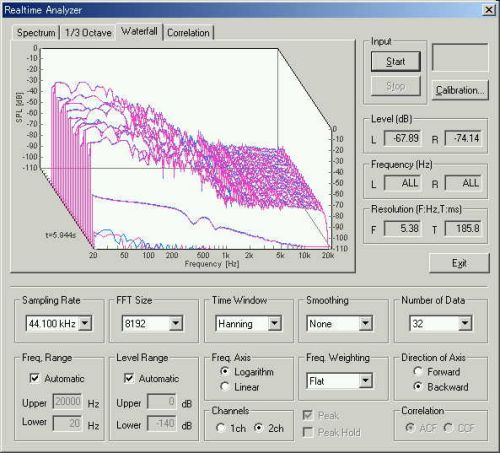
3D display of the power spectrum
March 2003 by Masatsugu Sakurai
From here, new measurement report written in 2004/07/19
The same data ![]() heart1.wav was loaded on the running ACF window. DSSF3 version 5.0.5.6 is
used on Windows XP. Measurement conditions are same.
heart1.wav was loaded on the running ACF window. DSSF3 version 5.0.5.6 is
used on Windows XP. Measurement conditions are same.
By clicking the "Replay" button at the bottom of the window, measured sound can be heard. Heartbeat is clearly recorded. I can see that the heart is working in a complex manner. It is difficult to listen to it by the built-in loudspeaker of PC, probably because of the frequency characteristics of the loudspeaker does not cover that of the heartbeat. You should use the headphones. I use SONY MDR-Z200.
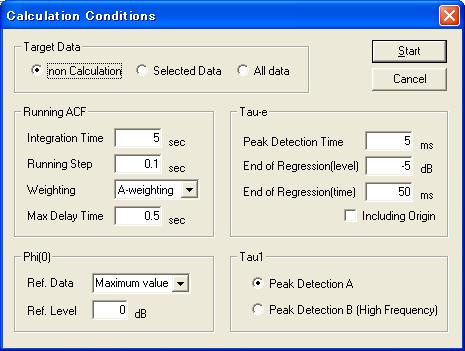
The measured data was analyzed by the following conditions. The integration time was set to 5 sec. It means that the sound level is averaged for 5 seconds. The running step was set to 0.1 sec. The sound is analyzed in every 0.1 second.
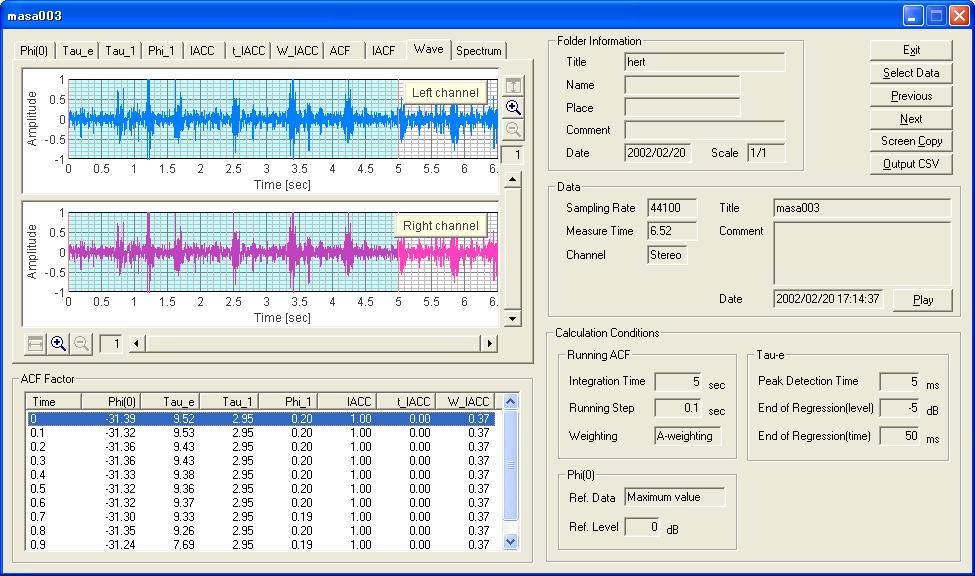
The figure below is the analysis result display. Now the temporal waveform of the recorded heartbeat is shown. Selected data portion is indicated by the blue area. Spectrum and ACF for this data portion is displayed. The selected data is also indicated in the "ACF factor" table below the graphs. By selecting the data from the table, graphs corresponding to that time are displayed.
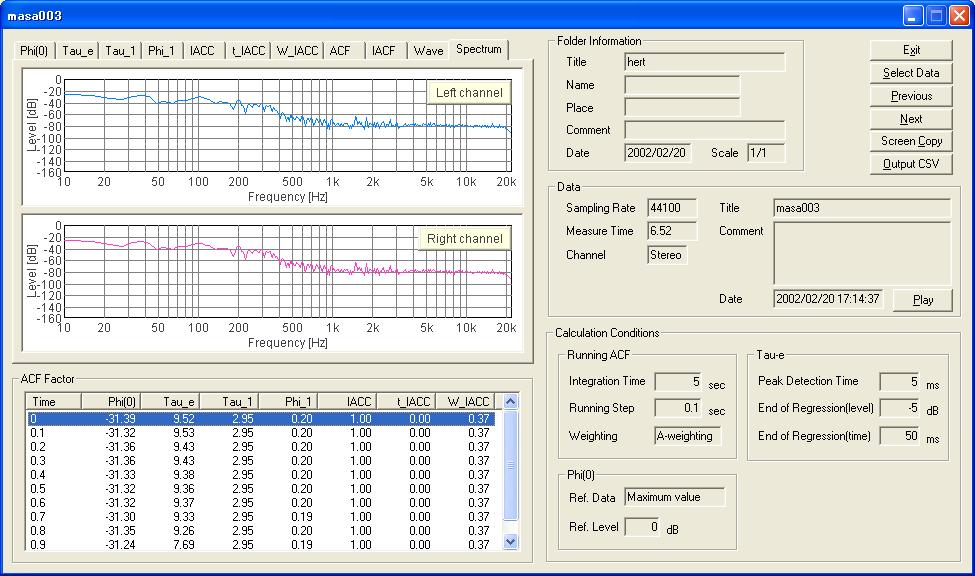
The next figure is the spectrum of that data portion.
I can see that the heartbeat contains high energy at low frequency up to 100 Hz with the maximum at 10-40 Hz. The high frequencies above 350 Hz are strongly decreased. In contrast, the lowest frequency of human voice is about 150 Hz for male voice and 250 Hz for female voice. Higher frequencies around several thousand Hz are also included in voice. Because the human ear sensitivity is tuned to the frequencies of voice, the sensitivity for low frequency such as 150 Hz is much worse. So, we need headphones to listen to the heartbeat carefully.
The next figure shows the time course of the sound level. Because the sound is averaged for long time (5 s) in this analysis, change of the sound level is quite small.
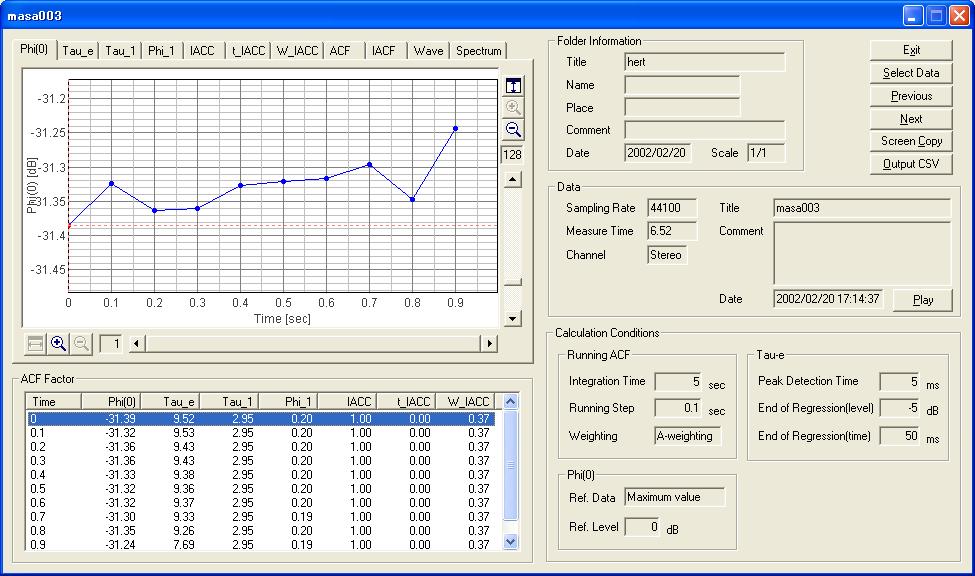
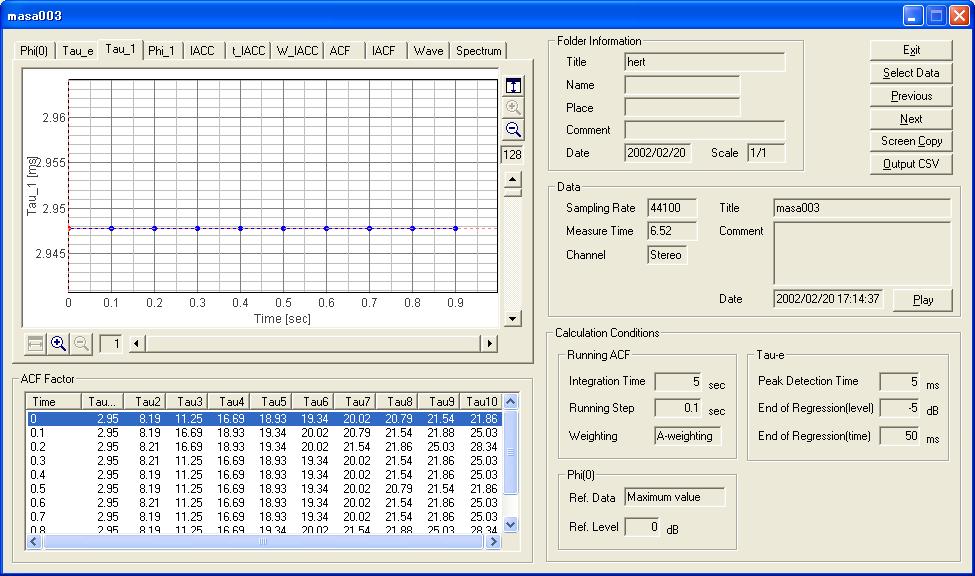
The next figure is the time course of τ1 value (time delay of the first peak in the ACF). It expresses the fundamental frequency of sound. In this case, τ1 of 2.95 ms means 339 Hz. It is also constant through the data. I aim to study the fluctuation of heartbeat using the those acoustic parameters.
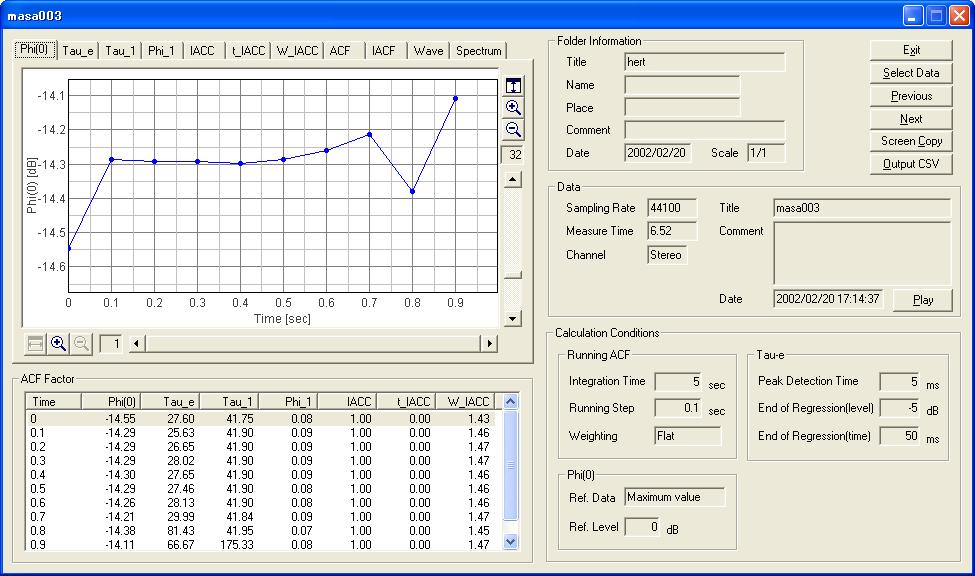
The analysis shown above was done considering the human ear's sensitivity (using the A-weighting filter). Next I did the same analysis with no frequency weighting. The next figure shows the time course of the sound level with no frequency weighting. At 0.9 s, the relative sound level is -14.1 dB. The difference from the previous analysis is about 17 dB.
Next figure is the spectrum calculated without the frequency weighting filter.
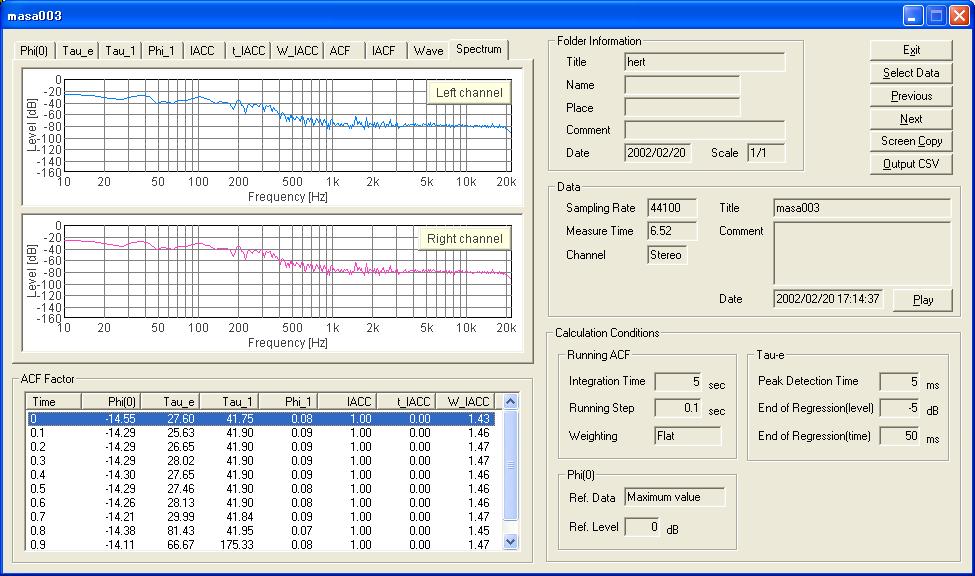
By seeing the spectrum, I understand why the conventional stethoscope has a low-pass frequency response up to about 300 Hz. However, the analysis of the auscultation sound is difficult by such a stethoscope because the actual heart sound contains very high frequency components. Closing sound of the mitral valve is 20 kHz and 8 ms pulse. Duration for closing is about 23 ms (See the heartbeat measurement 3).
2004/07/19