| Japanese | English |
This measurement was first done in 2003. I intended to analyze the heartbeat, because I have heard the motion of heart, the blood flow, and the closing sound of heart valve, from the recorded heart sound.
The FFT analysis is used to analyze continuous sound with long duration, but not suitable for analyzing a short impulsive sound like the heart sound. The running ACF analysis can measure sound from 0 Hz to the half of the sampling frequency of the D/A converter.
The heart sound can be analyzed using information such as the sound level, fundamental frequency, the formant frequency, and their time change, ratio of high and low frequencies.
Since the first measurement, DSSF3 has been much improved. The FFT analysis and the ACF analysis can be performed on exactly the same data. So, I decided to analyze the same data again. The results of the new analysis are reported in this page after the original report.
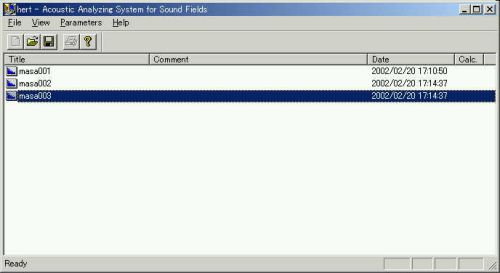
In order to analyze the last measurement, data is loaded in the Sound Analyzer.
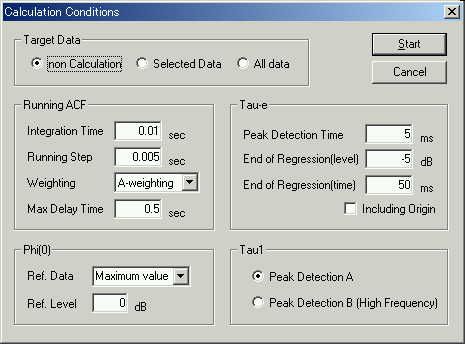
Calculation conditions were set as below. The integration time was set to 0.01 sec and the Running step (analysis interval) was set to 0.005 sec.

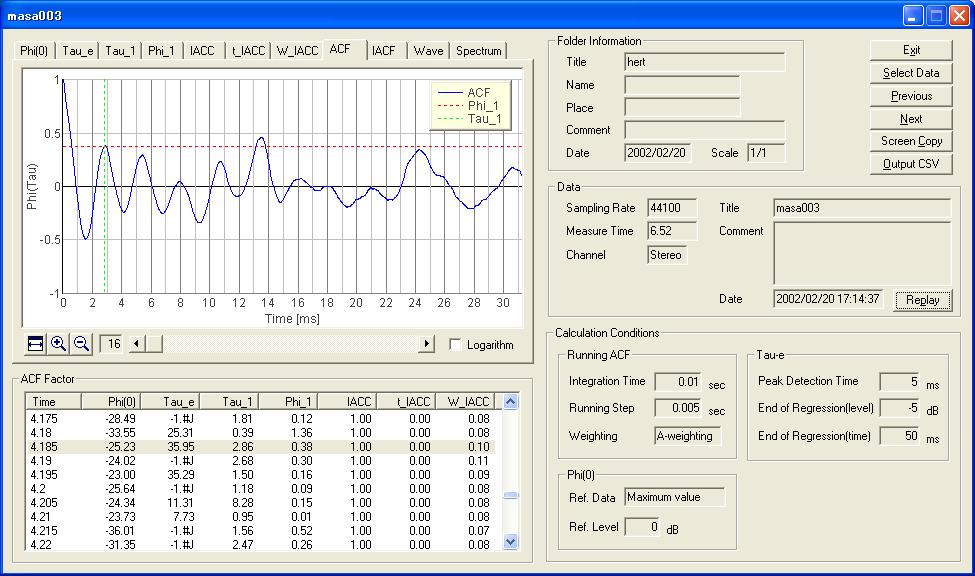
Below is the display of an analysis result. The following ACF factors are analyzed: sound level Phi(0), effective duration of the ACF Tau_e, fundamental frequency Tau_1, and pitch strength Phi_1.
The picture of the combination of graphs was created using the screen copy function of DSSF3. Click the "Screen Copy" button to capture the graph image. If "Only Graph" is chosen, the graphs in the window will be captured as below. If "Full Window" is chosen, all the information on this analysis Window will be captured.
The next figure shows the expanded measurement result around 1.2 seconds. One heart beat is zoomed up.
Next, medical interpretation of the heartbeat and the sound measurement results are compared. Data is same as Heartbeat measurement 1.
This is the calculation condition.
The graph of the sound level is zoomed in to the first heart sound. Time unit is 10 ms.
Only the first sound is zoomed in further.
As a medical interpretation, the first sound is divided into three parts. It is said that the first part has a comparatively low frequency. Second and third parts have a high frequency components. In this analysis, it seems that the first part starts at 4.16 second and ends at 4.21 second. Similarly, the second part is found from 4.22 to 4.26 second, and the third part is found from 4.27 to 4.31 second.
Let's see the sound from the beginning. At 4.165 s, the Tau_1 is 0.23 ms and the Phi_1 is 1.0. It means that a strong tonal sound (a sound with clear pitch) with high frequency (1000/0.23 = 4300 Hz) exists at this point. It seems that this raises the sound power later. It seems a valve sound. A similar sound component exists at 4.18 s. This sound has a clear pitch of 2.5 kHz.
In the second part, the 1 kHz weak pitch sound (at 4.21 s, Tau_1 is 0.95 ms and the Phi_1 is 0.01) changes to the 640 Hz strong pitch sound (at 4.215 s, Tau_1 is 1.56 ms and the Phi_1 is 0.5).
Now, the graph is zoomed in to the second sound. For the healthy person, the second sound has the interval between 20 and 50 ms. In this measurement, this interval was 40 ms from 4.5 to 4.54 s.
March 2003 by Masatsugu Sakurai
From here, new measurement report written in 2004/07/19
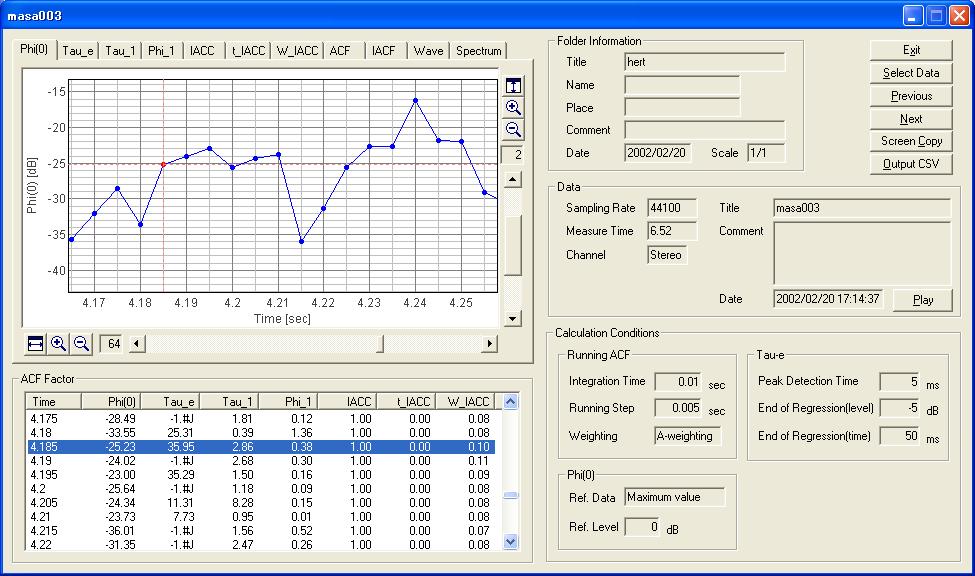
The same data is analyzed by the latest version of SA. The figure below is the result of the sound level. Two axes of the graph can be zoomed in. The display area of the graph can be changed by the mouse drag. The red mark on the graph indicates the analysis data frame as shown in the table below the graph.
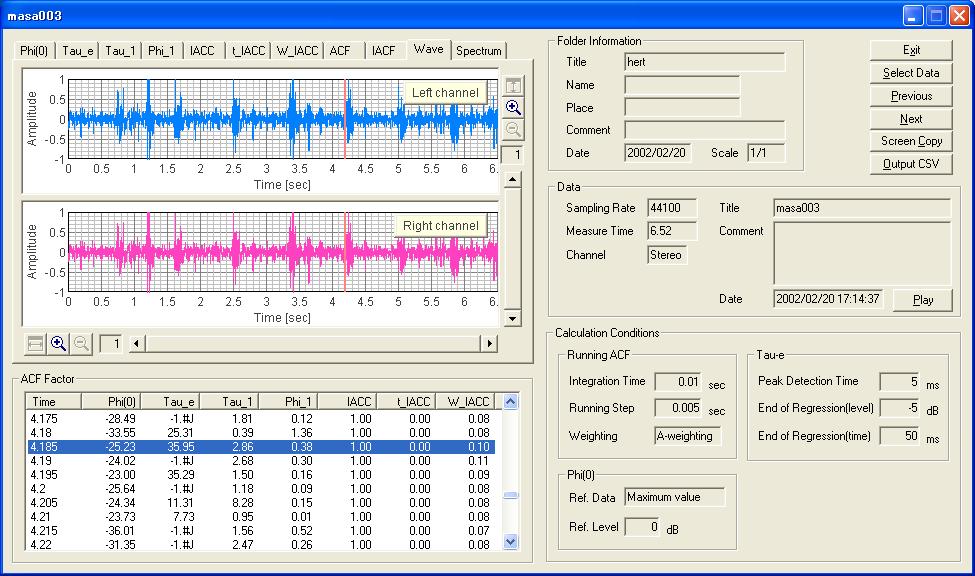
The next figure shows the temporal waveform of the recorded signal. The red line on the graph indicates the analysis data frame (4.19 s) as shown in the table below.
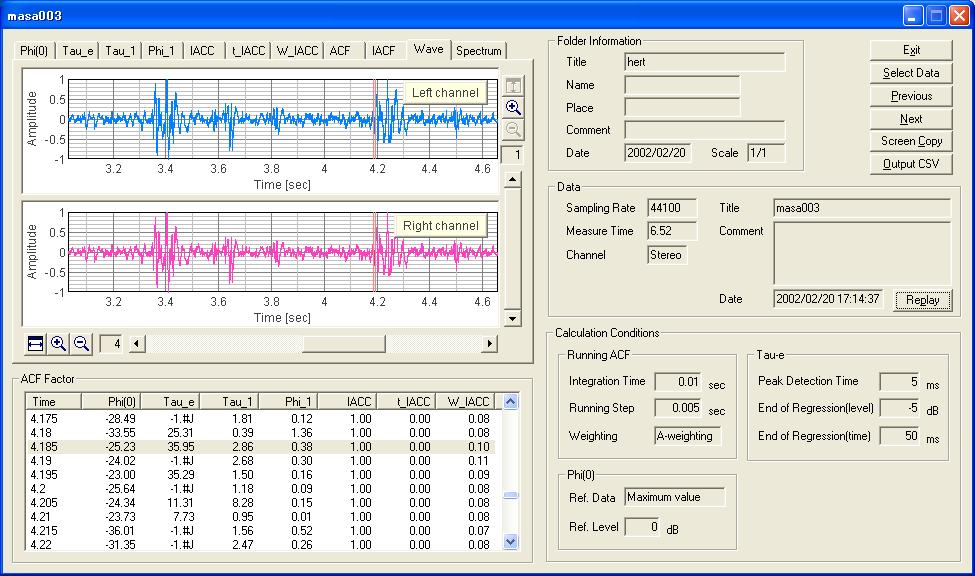
The waveform is zoomed in to x4 in the next figure. The peaks at 3.4 s and 4.2 s are both the first heart sound. Sound can be listened to by clicking the "Replay" button.
From this figure, we can see that the first sound occurs at every 800 ms. From this value, the heartbeat rate is found as 60 / 0.8 = 75 c/s. This time interval can be calculated accurately from the autocorrelation function.
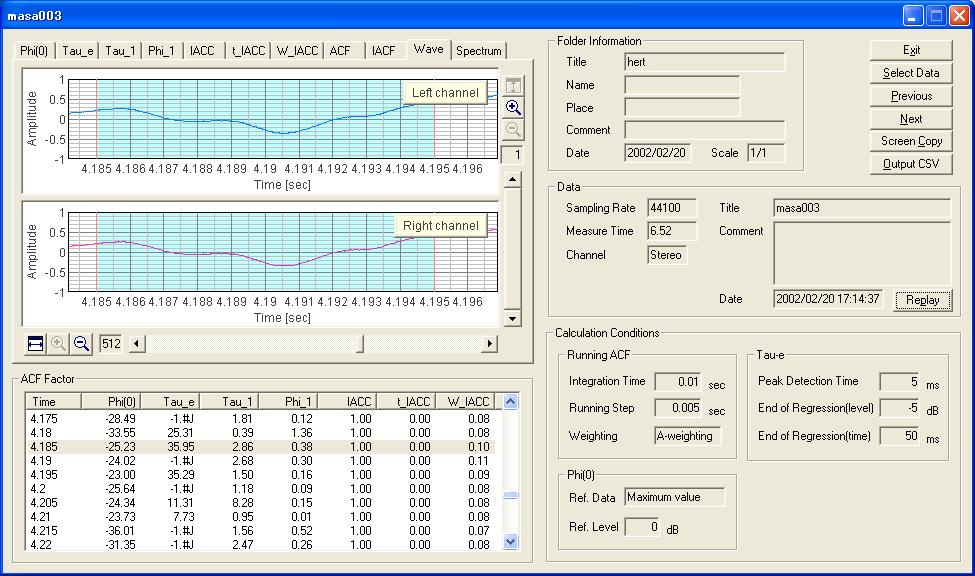
The same graph was zoomed in further. The one scale of the graph corresponds to 0.5 ms. The blue area in the graph indicates the "Integration time" of 0.01 s. The amplitude of the waveform increases from the minimum point at 4.1905, showing that this point is the start of the first sound.
The next figure shows the ACF of that data portion. The first peak of the ACF (Tau_1) is 2.86 ms, corresponding to the prominent frequency of 349 Hz. The fundamental frequency is found at 13.5 ms (74 Hz).
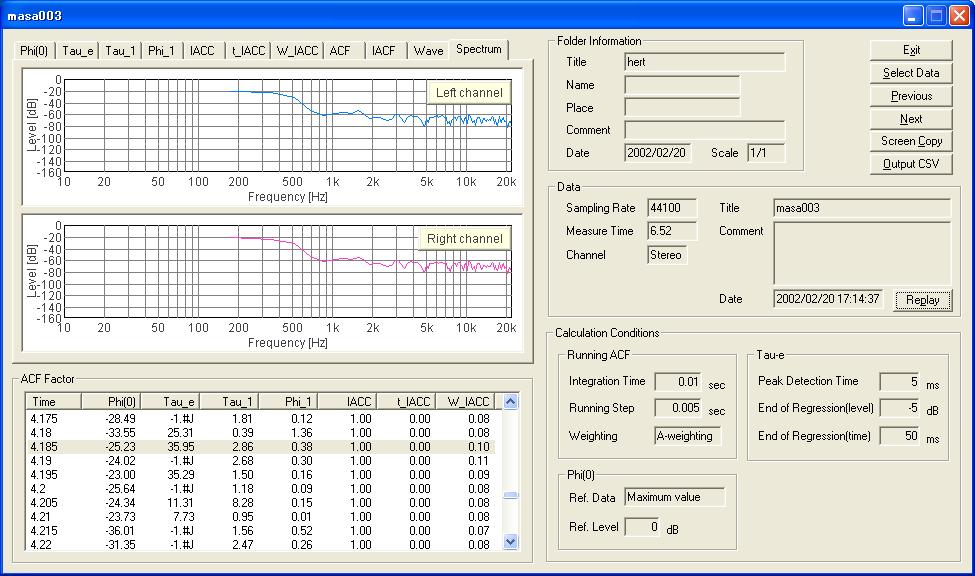
The next figure shows the spectrum of the same data portion.
Similar analysis is performed on the different data portion. In comparison with the first measurement reported in 2003, more accurate analysis is now possible.
2004/0719