| Japanese | English |
The results of the new analysis are reported in this page after the original report. The latest version of DSSF3 (ver.5.0.5.6) is used.
Original report written in 2003/04:
This time, vowel /a/ is analyzed in more detail.
vowel data: ![]() voice1.wav (44.1kHz / Stereo / 2.78sec / 480KB)
voice1.wav (44.1kHz / Stereo / 2.78sec / 480KB)
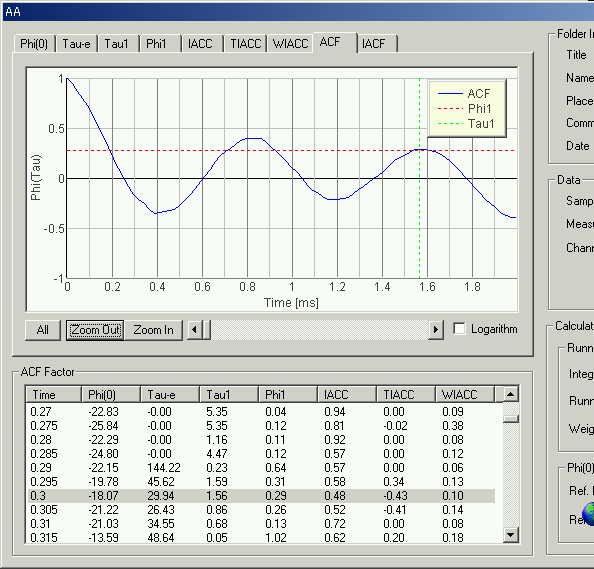
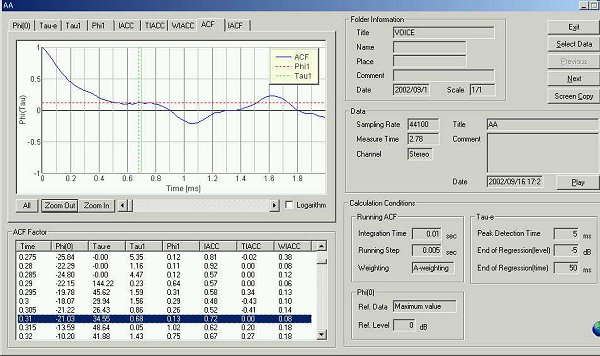
5ms after utterance. (0.29 second after the measurement began)
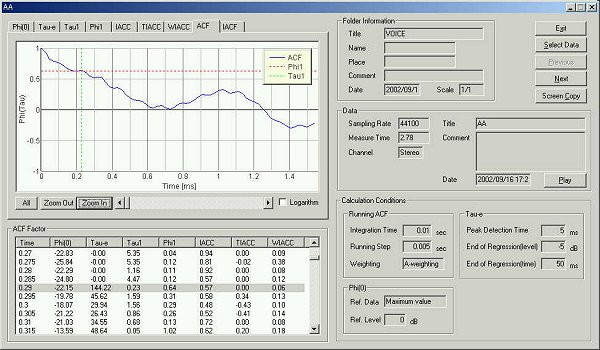
The ACF has small peaks at 0.23, 0.34, 0.41, 0.55, 0.68, 0.91, 1.02, 1.11 ms. These peaks might correspond to the peak frequencies in the spectrum.
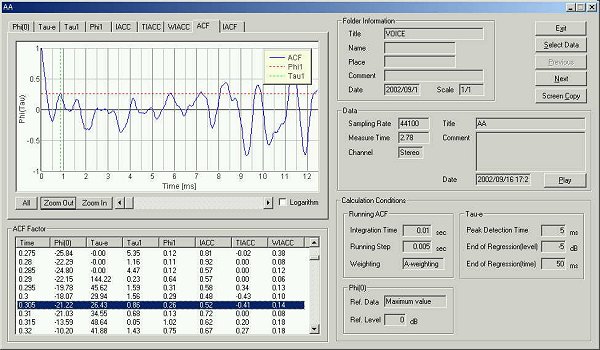
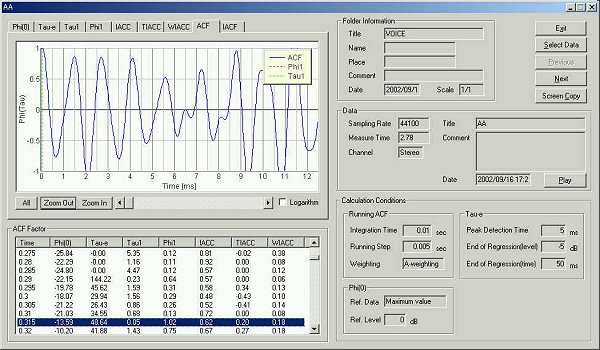
10 ms after utterance.
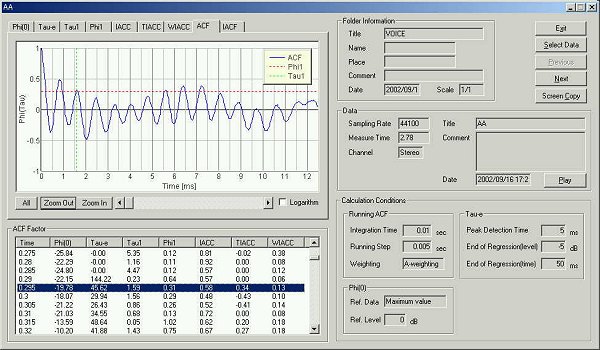
There are several peaks between 5 and 8 ms (i.e. this is the range of the fundamental frequency) and it is not clear which is the fundamental frequency. It is thought that fundamental frequency is not analyzed, since in this stage time is too early (only 10ms has passed) and the required information cannot be captured. As stated later, more than 20 ms was necessary to acquire the fundamental frequency.
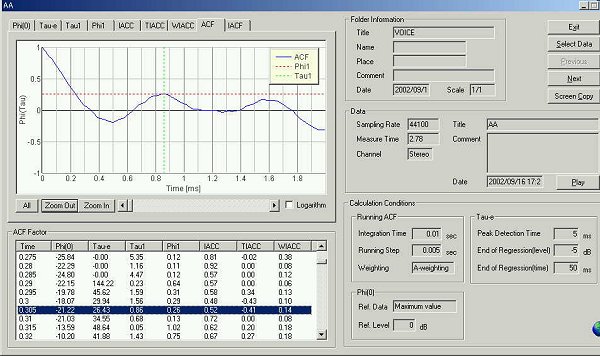
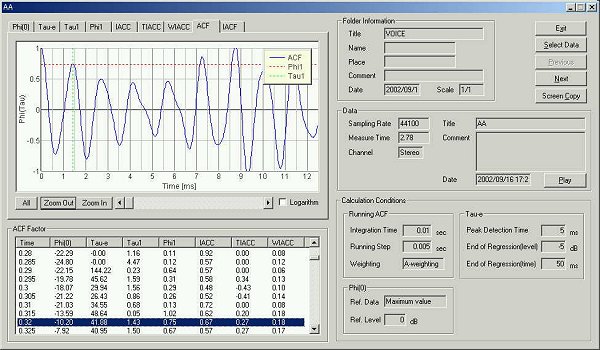
Enlarged graph
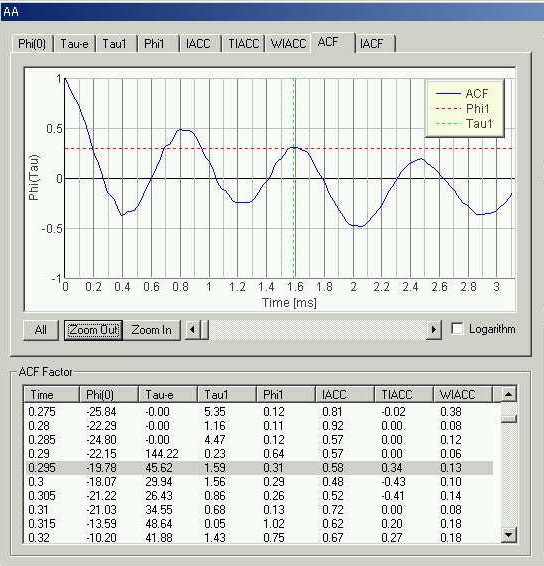
In the figure above, the maximum peak is seen at 0.8 ms. This corresponds to the formant frequency. 1000/0.8=1250 Hz
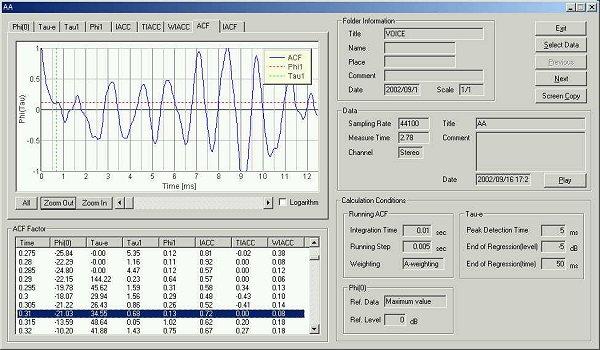
15 ms after utterance
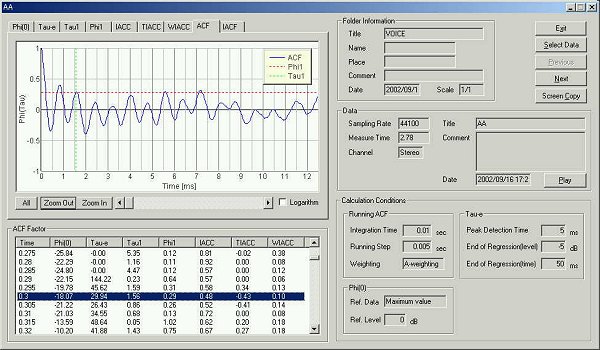
First two peaks are at 0.8 and 1.56 ms. The fundamental frequency can be small peaks between 5 and 8 ms.
Enlarged graph
Peak at 0.8 ms corresponds to the formant frequency 1000/0.8=1250 Hz
20 ms after utterance.
Compared with before, sound power has fallen by -3dB.
At this stage the fundamental frequency can be identified.
Peak at 8.35ms corresponds to the fundamental frequency 119Hz
Enlarged graph
Peak at 0.86ms corresponds to the formant frequency 1000/0.86=1162 Hz
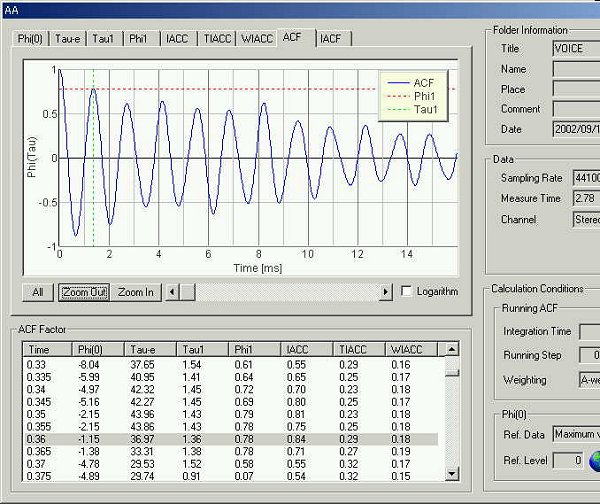
25 ms after utterance.
te is 34.45 ms.
Peaks are found at 0.68 and 1.61 ms. Fundamental frequency is found at 8.39ms
(119Hz).
Enlarged graph
The lowest peak in the spectrum is called the first formant (F1), followed by the other formants F2, F3, and so on. In the ACF graph above, there are four peaks and valleys as follows. The peak at 1.61 ms is the first formant frequency (613 Hz ) in this stage, but its amplitude is small. Also the 769Hz component (peak at 1.3 ms) has shifted to 720Hz shortly after this. Considering these results, this ACF might represent the transient state of the utterance.
This ACF expresses the peak of the power spectrum of /a/ clearly. It turns out that information important for the speech recognition might be included in the first 25 ms.
30 ms after utterance
te is 48.64 ms. Fundamental
frequency is found at 8.8 ms (113 Hz).
Formant frequency is found at 1.5 ms (666 Hz)
35 ms after utterance
te is 41.88 ms. Fundamental frequency is at 8.75 ms (114 Hz) and formant frequency is at 1.43 ms (699 Hz)
75 ms after utterance
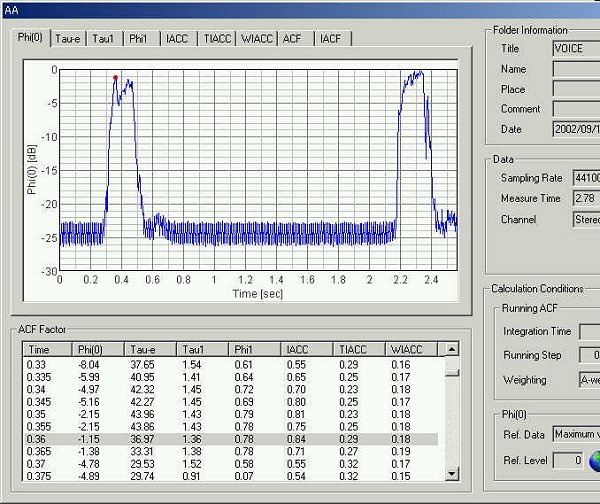
te is 36.97 ms.
Formant frequency is at 1.36 ms (735 Hz), and the fundamental frequency is
at 8.21 ms (121 Hz).
This graph shows the time change of the power level. The red point indicates the peak level. Since the utterance started, 75ms has passed. It seems that the speaker maintains the sound power, and is adjusting utterance time.
This time, the fundamental frequency and the formant frequency were analyzed from the high time resolution running ACF. In this running ACF measurement in every 5 ms, the fundamental frequency was identified until 20 ms after the utterance. The second and third formant frequencies ware identified until 25 ms, and the first formant of 660-730 Hz was found at 30 ms after the utterance.
April 2003 by Masatsugu Sakurai
From here, written in 2004/07/16
In this measurement, I noted the point that the language could tell much information quickly in human's conversation. In how much time do we understand the contents? The way of recognition may differ from recognition of the sound which has a meaning as for the recognition of meaningless pronunciation like a single vowel "a."
In the previous measurement, the Japanese vowel "a" was analyzed in every 5 ms to find the moment at which we can recognize it as "a". I found that the fundamental frequency was identified until 20 ms after the utterance. The second and third formant frequencies ware identified until 25 ms, and the first formant of 660-730 Hz was found at 30 ms after the utterance.
This time, the time change of the spectrum is analyzed by using the high time resolution FFT analysis.
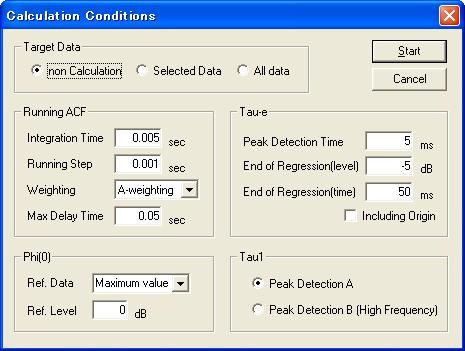
The integration time is set to 5 ms to focus on the formant frequency. Below 200 Hz is not necessary. The running step is set to 1 ms.
Note: I intended to report the analysis of data voice1.wav, but by mistake I analyzed voice3.wav reported in Analysis of the Japanese voice 3, since I have forgotten about the measurement at two years ago. So, keep in mind that this report is result of a female voice. If you are interested in male voice too, download voice1.wav and try the same analysis.
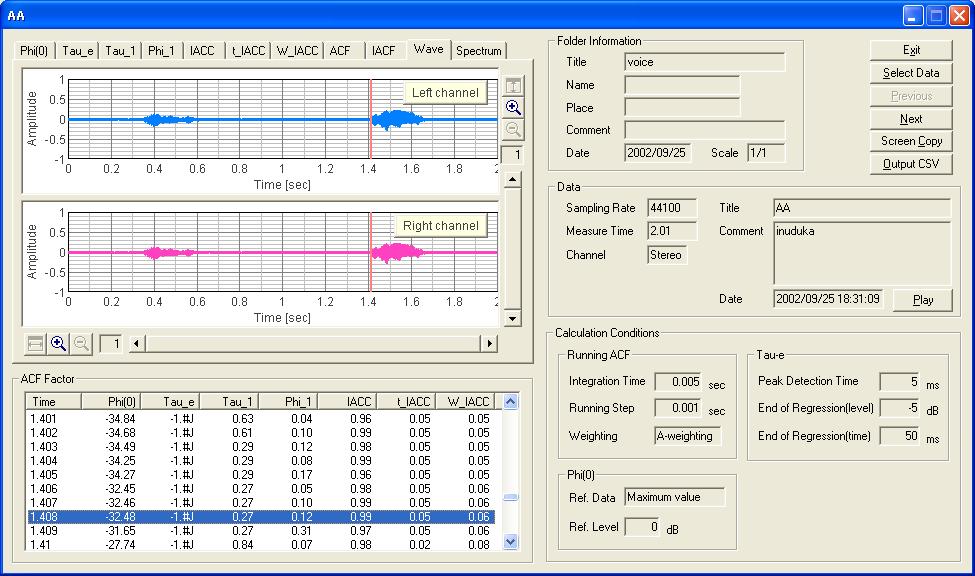
The figure shows the temporal waveform of the data analyzed. In the graph, the portion between 1.408 and 1.413 s (5 ms) is selected.
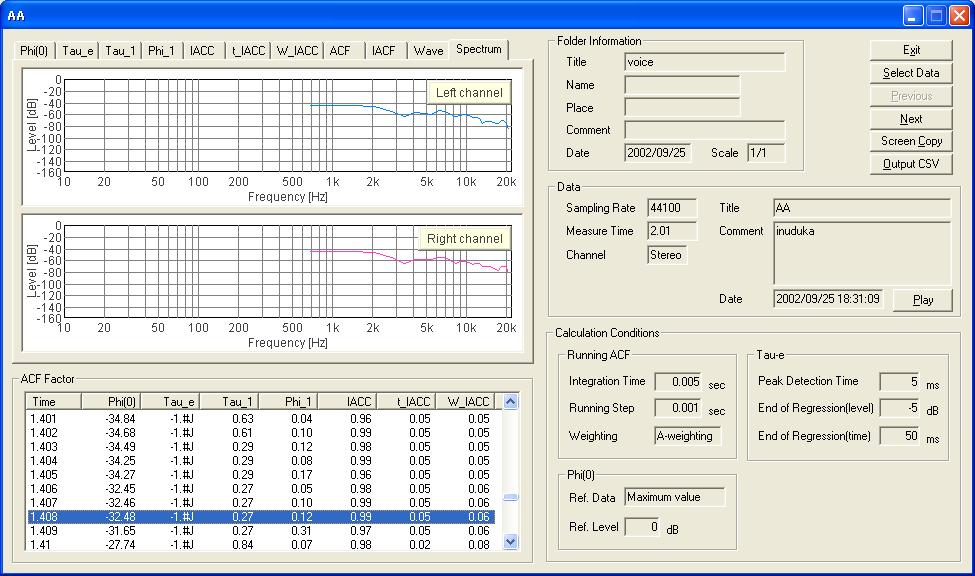
The next figure shows the spectrum of data portion between 1.408 and 1.413 s. Because the analysis time length is very short, the low frequency region cannot be analyzed and the frequency resolution is low.
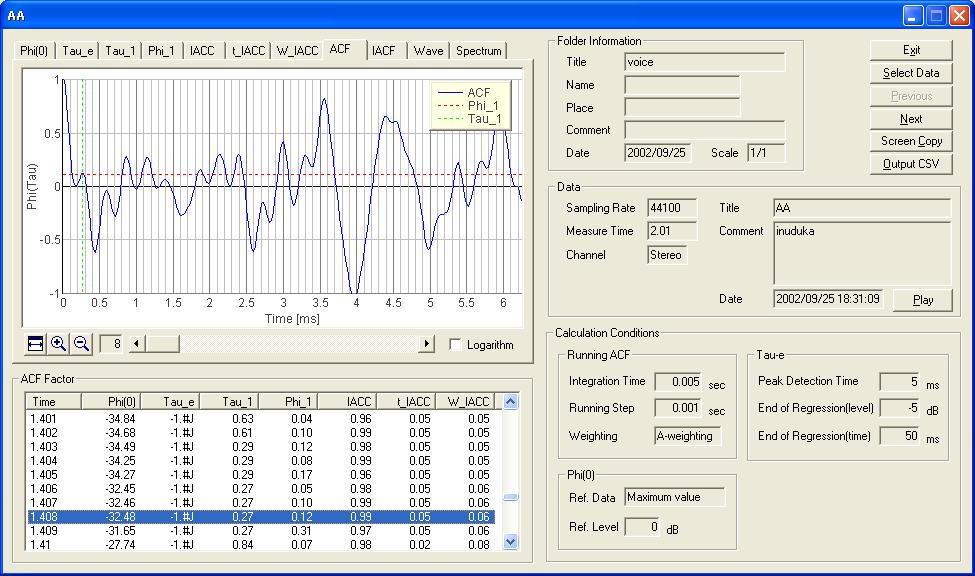
Next figure is the ACF of the same data portion. I can see the fundamental frequency at 3.6 ms (277 Hz).
The same graph is zoomed in to x32. The first peak is found at 0.27 ms. This corresponds to 3700 Hz. Next peaks are at 0.85 ms (1176 Hz) and 1.13 ms (884 Hz). These two frequencies are considered to be formants of "a."
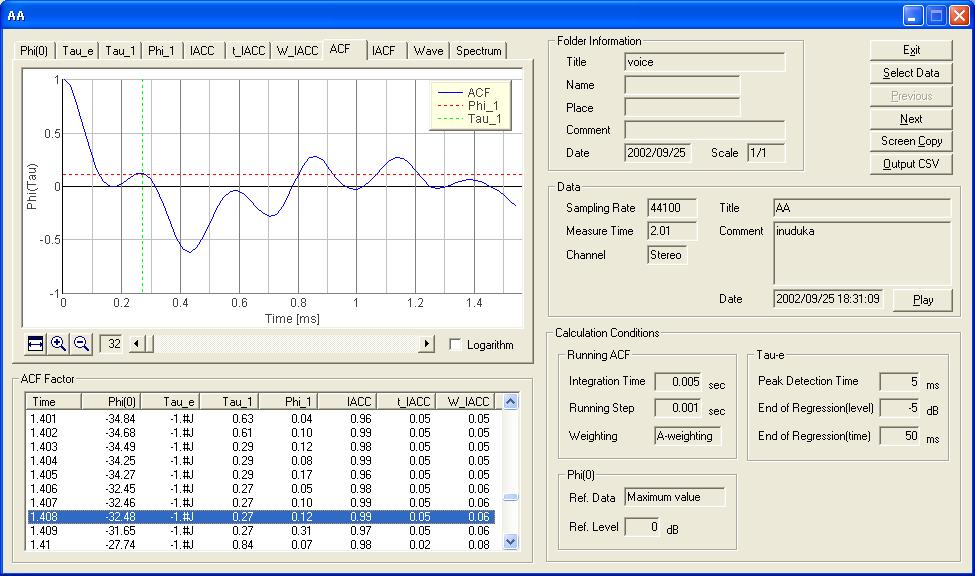
I found that the ACF analysis is useful to extract formants. On the other hand, the spectrum with the very short analysis time was useless. I can say that the spectrum should be calculated for longer data length to produce a stable result for estimating formants.
2004/07 by Masatsugu Sakurai