| Japanese | English |
| Date: | 10:00, 30 Sep. 2002 |
| Place: | Nagoya, Japan |
| Microphone: | SONY ECM-MS957 |
| Microphone amplifier | SONY DAT WALKMAN TCD-D100 |
| Personal computer: | DELL INSPIRON 7500 |
| OS: | Windows 2000 Professional |
| Software: | DSSF3 |
| WAVE sound file: |
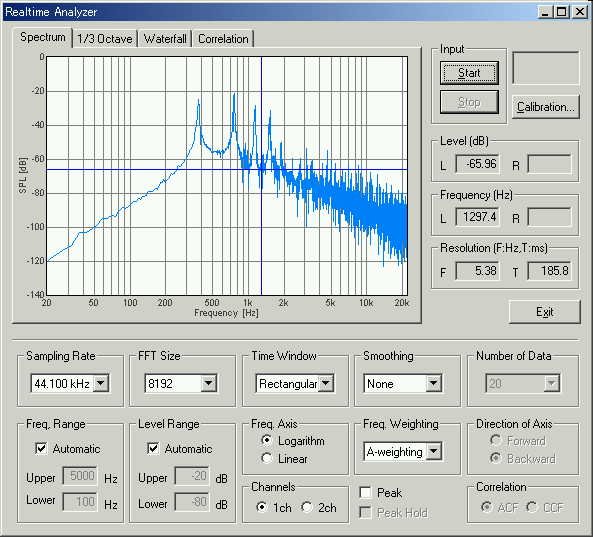
This is the power spectrum of the second utterance "a".
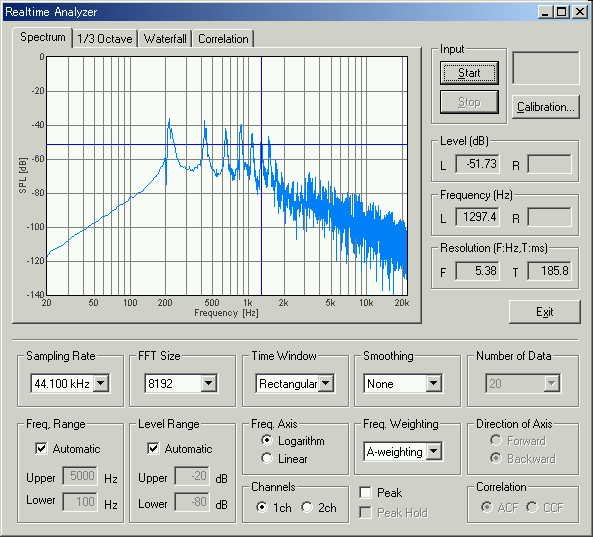
In the spectrum, the peak frequencies are seen at 210Hz, 420Hz, 640Hz, 840Hz, 1050Hz, 1260Hz, 1470H and so on. This is a clear spectrum. The high frequency range of the spectrum roughly decreases 6dB/oct. It is the general characteristic of the speech signal. The fundamental frequency is at 210 Hz and the first formant (F1) frequency is at 840 Hz.
This is the spectrum of the forth utterance.
This is also a clear spectrum. The fundamental frequency at 250 Hz and the F1 at 750 Hz can be seen.
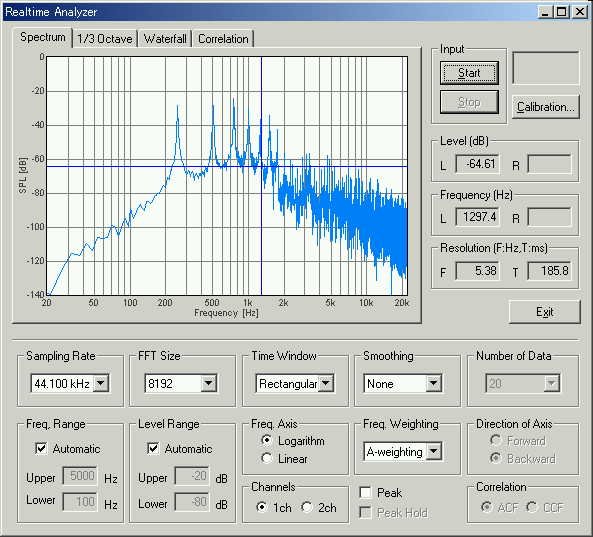
This is the spectrum of the sixth utterance.
The fundamental frequency at 330 Hz and F1 at 660 Hz can be seen.
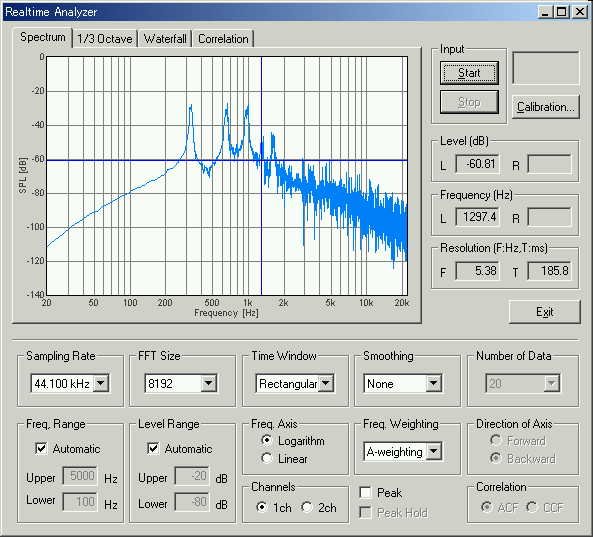
This is the eighth utterance.
The fundamental frequency is at 370 Hz and the F1 frequency is at 740 Hz. As we can see so far, one of the harmonics becomes formant frequency. But it seems that the harmonic number that becomes formant depends on the fundamental frequency.
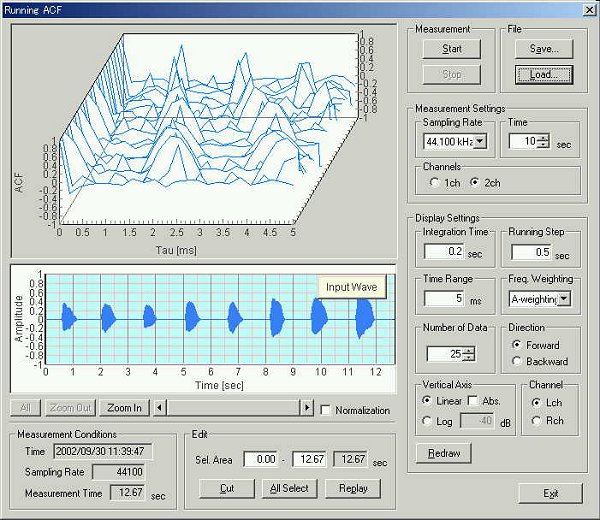
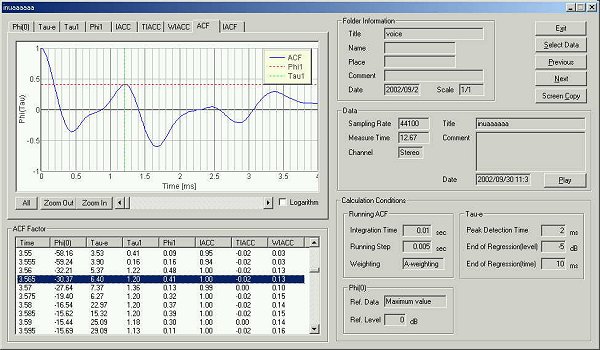
Next, the same data is analyzed by the running ACF. Let's see the ACF analysis for every 5ms in order after the utterance starts.
This is the running ACF analysis window. Load the file and start the
measurement with the different settings. The integration time and the running
step were set at 10 ms and 5 ms.
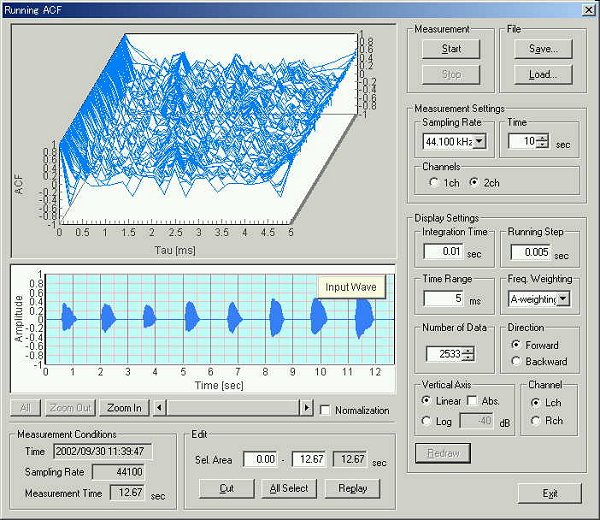
There are eight utterances. Pitch was raised in order.
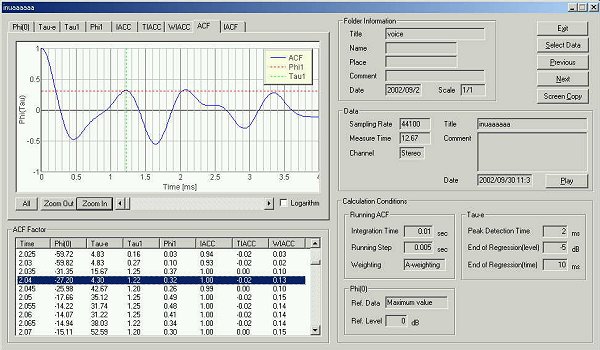
The ACFs measured after around 10 ms for each utterance are compared.
This is the ACF from 5 ms to 15 ms of the first utterance.

The te value is 4.69 ms. In the rise process of the power from an utterance start to the peak level, the te roughly decreases. It seems that there is a relation between the te and the way of utterance. In the ACF there are peaks at 0.73, 1.0, and 1.3 ms and so on. The fundamental frequency can not be identified yet.
As has been revealed in the previous experiment, the first small peaks in the ACF are corresponded to the formant frequencies F1-F3 in the spectrum. This seems to happen when the low frequency band has not been analyzed yet.
The data obtained in the previous test are as follow.
This is the ACF at 10 ms of the second utterance.
This is the ACF at 10 ms of the third utterance.
The ACF at 15 ms of the third utterance.
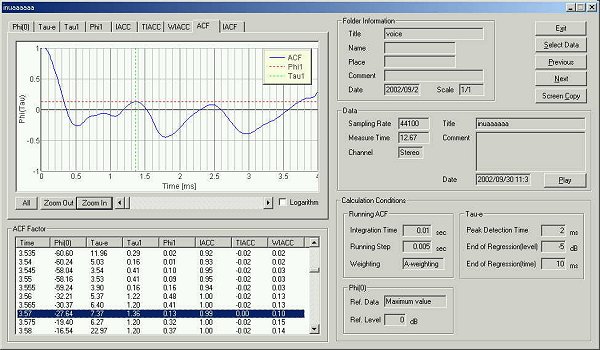
In the last two ACF, the measured formant frequency has changed more than 100 Hz from 10 ms to 15 ms after the utterance began. I thought it is meaningless to look for the formant as I did, because the fundamental frequency and formant frequency change heavily during only 5ms.
If uttered by changing a pitch, all frequency will change. It is said in the textbook that the fundamental frequency and the formant frequency are constant during the utterance. But actually those are changing heavily. It is easy to identify the formant from the ACF analysis but it seems difficult to continue the voice recognition by means of the formant.
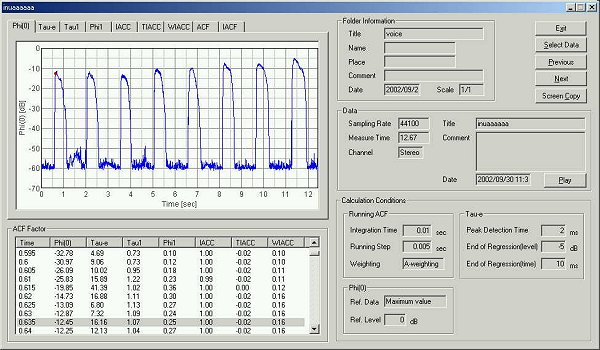
I thought whether the voice analysis could be performed directly from the parameter of the ACF. Below, all the ACF parameters are shown to compare their time change.
The figure below shows all of the ACF and the IACF parameters. This figure
can be output by one click using the screen copy function of the DSSF3.
In the t1 graph, the pitch change can
be seen clearly. The longer t1 the lower
the pitch, because the t1 means one cycle
length of the signal. As for the other parameter, the f1
represents the pitch strength, and the te
represents the reverberation of the signal. The problem to be tackled is whether
the voice signal can be analyzed and identified by means of the combination of
those ACF parameters. In the table below, three ACF parameters are summarized
for the eight utterances.
| Time | utterance(ms) | t1(ms) |
f1 |
te(ms) | |
| 1st | 0.615 | 25 | 1.02 | 0.36 | 41.39 |
| 0.62 | 30 | 1.11 | 0.3 | 16.88 | |
| 0.625 | 35 | 1.13 | 0.27 | 6.8 | |
| 0.63 | 40 | 1.09 | 0.24 | 7.32 | |
| 2nd | 2.035 | 5 | 1.25 | 0.37 | 15.67 |
| 2.04 | 10 | 1.22 | 0.32 | 4.3 | |
| 2.045 | 15 | 1.2 | 0.26 | 42.67 | |
| 2.05 | 20 | 1.25 | 0.49 | 35.12 | |
| 2.06 | 25 | 1.25 | 0.41 | 31.22 | |
| 3rd | 3.56 | 5 | 1.22 | 0.48 | 5.37 |
| 3.565 | 10 | 1.2 | 0.41 | 6.4 | |
| 3.57 | 15 | 1.36 | 0.13 | 7.37 | |
| 3.575 | 20 | 1.2 | 0.32 | 6.27 | |
| 3.58 | 25 | 1.2 | 0.37 | 22.97 | |
| 4th | 5.07 | 15 | 1.2 | 0.49 | 8.56 |
| 5.075 | 20 | 1.22 | 0.38 | 4.94 | |
| 5.08 | 25 | 1.22 | 0.29 | 16.1 | |
| 5.085 | 30 | 1.2 | 0.42 | 18.51 | |
| 5th | 6.595 | 15 | 1.29 | 0.28 | 14.03 |
| 6.6 | 20 | 1.25 | 0.41 | 8.36 | |
| 6.605 | 25 | 1.2 | 0.66 | 7.76 | |
| 6.61 | 30 | 1.16 | 0.49 | 7.76 | |
| 6.615 | 35 | 1.18 | 0.58 | 12.48 | |
| 6.62 | 40 | 1.2 | 0.31 | 12.03 | |
| 6th | 8.14 | 5 | 1.18 | 0.49 | 6.45 |
| 8.145 | 10 | 1.29 | 0.82 | 33.04 | |
| 8.15 | 15 | 1.25 | 0.51 | 11.03 | |
| 8.155 | 20 | 1.25 | 0.5 | 8.11 | |
| 8.16 | 25 | 1.22 | 0.53 | 60.22 | |
| 8.165 | 30 | 1.22 | 0.53 | 27.77 | |
| 8.17 | 35 | 1.2 | 0.52 | 20.53 | |
| 8.175 | 40 | 1.18 | 0.59 | 84.69 | |
| 7th | 9.65 | 10 | 1.3 | 0.3 | 4.91 |
| 9.655 | 15 | 1.27 | 0.54 | 139.92 | |
| 9.66 | 20 | 1.22 | 0.48 | 50.91 | |
| 9.665 | 25 | 1.2 | 0.5 | 25.74 | |
| 9.67 | 30 | 1.16 | 0.45 | 37.18 | |
| 8th | 11.24 | 5 | 1.3 | 0.15 | 18.8 |
| 11.245 | 10 | 1.25 | 0.35 | 5.69 | |
| 11.25 | 15 | 1.25 | 0.6 | 6.77 | |
| 11.255 | 20 | 1.25 | 0.5 | 4.45 | |
| 11.275 | 40 | 1.27 | 0.53 | 29.25 |
You can find more information about the te
value in "Architectural acoustics" by Yoichi Ando. It is said
"Since the minimum value of the moving te
is the most active part of each piece of, containing important information and
influencing subjective responses for the temporal criteria ..... ."
When a voice is analyzed in very short time (every 5 ms in this experiment), high frequency sound with short wavelength can be analyzed first in a short time. The low-pitched sound with long wavelength is analyzed later. When that very short time could be analyzed well, the formant was identified from the peak of the autocorrelation.
It is important to analyze a time range that contains most amount of information. The te becomes the minimum when change of a sound signal is the largest. For example, it is a time of pronouncing strongly, or stopping utterance and going into the next utterance. That moment might be important for voice analysis. It is the reason I pay my attention to te.
|
|
Time |
utterance (ms) |
t1(ms) |
f1 |
te(ms) |
|
1st |
0.625 |
35 |
1.13 |
0.27 |
6.8 |
|
2nd |
2.04 |
10 |
1.22 |
0.32 |
4.3 |
|
3rd |
3.575 |
20 |
1.2 |
0.32 |
6.27 |
|
4th |
5.075 |
20 |
1.22 |
0.38 |
4.94 |
|
5th |
6.605 |
25 |
1.2 |
0.66 |
7.76 |
|
6th |
8.14 |
5 |
1.18 |
0.49 |
6.45 |
|
7th |
9.65 |
10 |
1.3 |
0.3 |
4.91 |
|
8th |
11.255 |
20 |
1.25 |
0.5 |
4.45 |
April 2003 by Masatsugu Sakurai