
|
In the new version of MMLIB (version 1.0.4.8 or later), window image of RA/SA/EA can be copied into MMLIB using the Windows clipboard. This new function supports all other Windows applications. Attached image of email or Fax is easily stored in the multimedia database.
Cooperation of SA with MMLIB is now available in RA series version 2. Specified graph images in the RA and SA window are easily imported in MMLIB.
MMLIB (multi-media library) has been upgraded (version 1.0.4.8). Graph images of RA, SA, and EA can be imported to MMLIB easily by using the "Window Copy" function. See the page for how to use the window copy function.
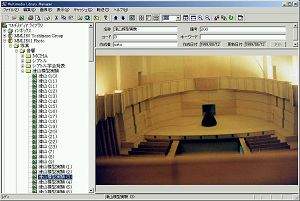 |
This is an example of picture stored in MMLIB. |
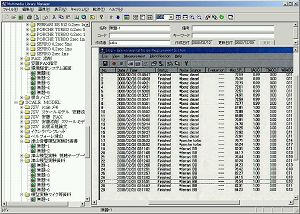 |
This is an example of a data of the Sound Measurement system. Measured data can be imported to MMLIB by one click. |
 |
MMLIB can also be used as a research database. Huge data is classified and arranged easily. |
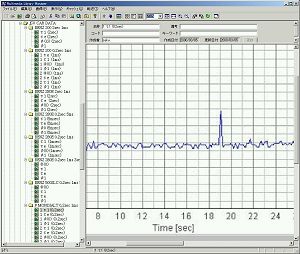 |
Graph in the above figure is expanded. High resolution picture of MMLIB can be expanded to make it legible. |
Research database
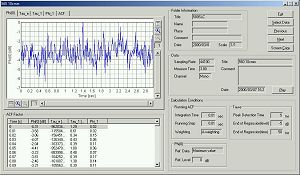 |
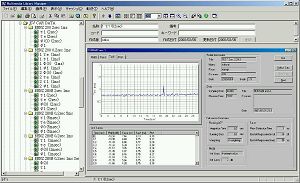
This is a graph of SA (Sound analyzer). Screen copy function is used to import a graph to MMLIB. |
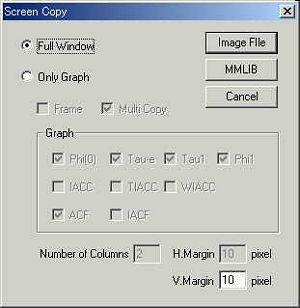 |
Click the MMLIB button to import a graph to MMLIB, whereat... |
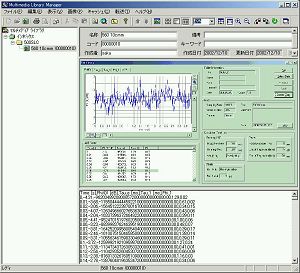 |
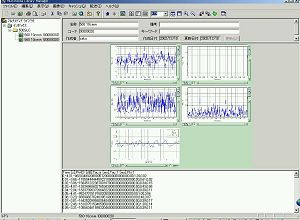
The captured image is displayed on MMLIB. This image is stored in the MMLIB database instantly. The left side is a folder tree view. Folder name and file name are displayed. The right top is a data information. The right middle is a picture window. The right bottom is a text data window. For the SA data, measured parameters are stored as a CSV format. |
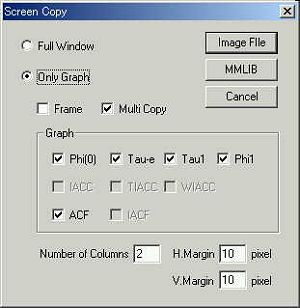 |
By the screen copy function, graphs to be imported can be specified. Here, only five graphs are chosen. |
 |
This is the output. Five graphs are arranged and saved as one picture. |