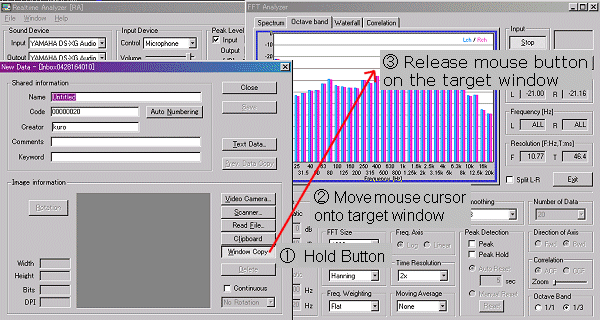
1. Save measurement screen as screen copy
As same as in other Windows applications, screen copy function is a useful way of preserving the current state of the active window. Click alt+PrtScr key to capture screen, and then paste to the paint software. Furthermore, in the FFT analyzer and the oscilloscope, "Screen Copy" button is available. During the measurement, any number of snapshots can be created just by one click.
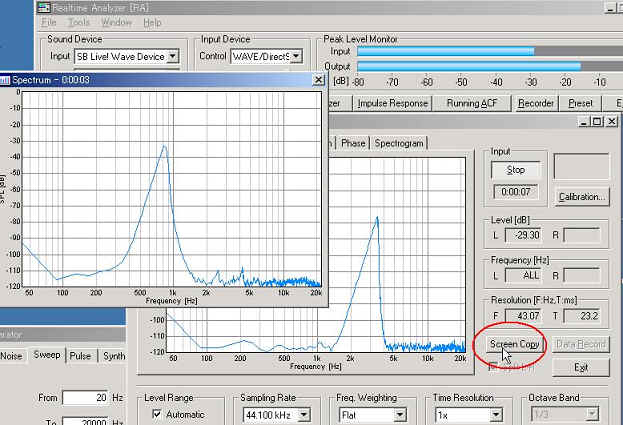
For saving and printing the measurement screen as picture files, we recommend the image database software, MMLIB. Measurement data and graph images can be easily stored to construct a measurement database.
2. Save sound and measure repeatedly
It is a convenient way to record sound and analyze it later. To start recording, check the Recording box on the Recorder window.
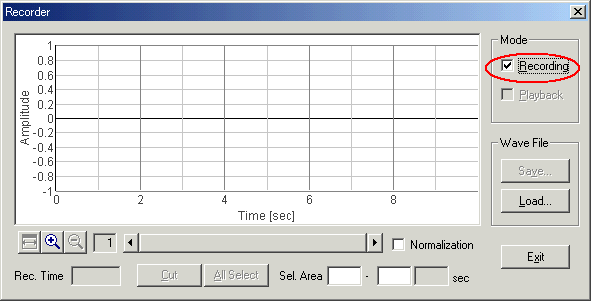
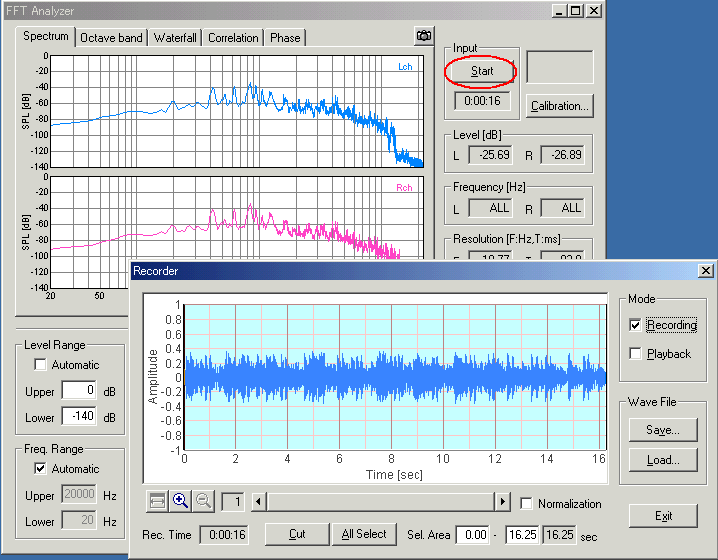
Then, start one of the Signal Generator, the FFT Analyzer, or the Oscilloscope. When the FFT Analyzer or the Oscilloscope is started, the input signal is recorded and analyzed at the same time. When the Signal Generator is started, the generated signal is recorded. To stop recording, click the Start/Stop button of the window that was started.
Once the sound is recorded, it can be analyzed repeatedly. To start playback of the recorded signal, check the Playback on the Recorder window, and start the FFT Analyzer or the Oscilloscope. The recorded signal is played and analyzed by the FFT Analyzer or the Oscilloscope.
Recorded signal can also be saved as a .wav format. Saved file can be analyzed later and can be used by other applications. Sound file can be saved in the Impulse response window and the Running ACF window too. See the related manual pages for details.
3. Save numerical data
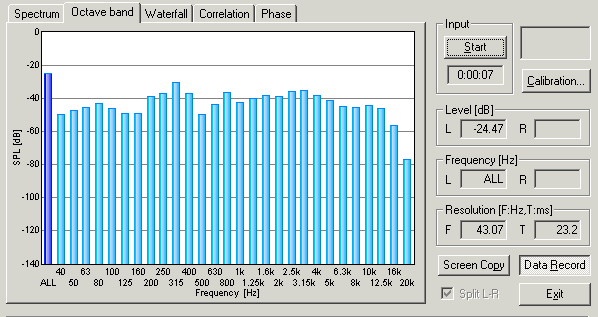
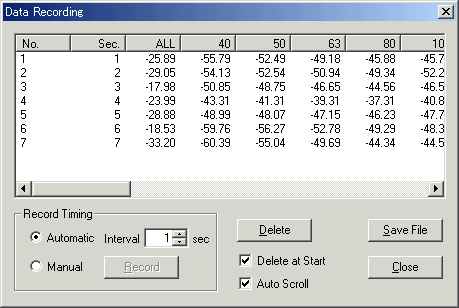
In the octave band analyzer, measured sound pressure levels in all-pass and each octave band frequency can be recorded and exported as a csv format. During the octave band analysis, click the "Data Record" button to open the data recording window.
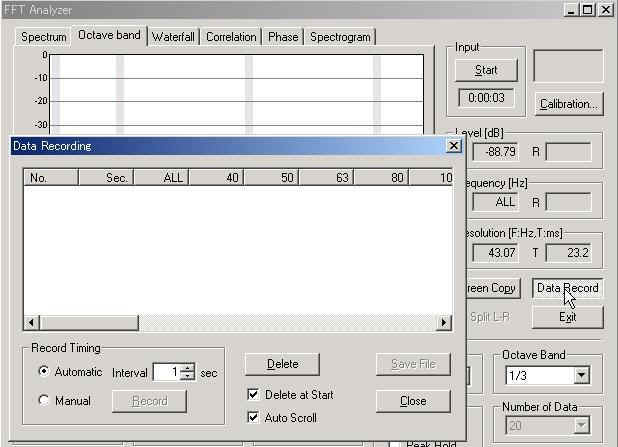
On the Data Recording window, record timing can be selected from automatic and manual. In the automatic mode, data is recorded in every interval. Minimum recording interval is 1 second. In the manual mode, data is recorded when the Record button is clicked.
For example, select the Automatic for record timing and start the measurement in the FFT analyzer. Then the octave band level is recorded automatically. Recorded data can be save as a CSV format, which is manipulated by other applications like Microsoft Excel.
4. Save measurement data and analyze by Sound Analyzer
In the impulse response measurement and the running ACF measurement (not included in DSSF3 Light, higher versions are required), measured data is saved for analyzing in Sound Analyzer. Room acoustics parameters like reverberation time and IACC are calculated from the impulse response. In the Running ACF (auto-correlation function) and CCF (cross-correlation function) analysis, sound is analyzed from the acoustic parameters, such as the sound level, pitch frequency and its strength, reverberant component, perceived sound source direction and width. Tone quality, location and movement of sound source can be analyzed by discovering the combination of important sound parameters and finding out the feature point.
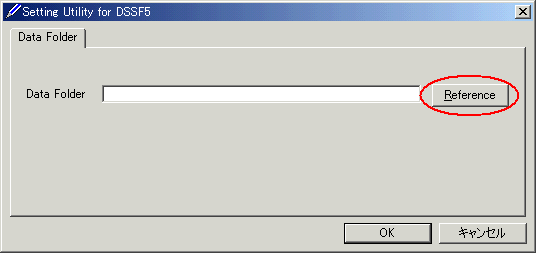
Measurement data for Realtime Analyzer, Sound Analyzer, and Environmental noise Analyzer is stored in the common database. All of the measured data and the microphone calibration data can be managed with each data folder. Data folder can be specified by using the setting utility (DSS.exe). Wherever the measurement data is saved (even in the other computer on the network), DSSF3 can use that data. By this function, management of the measurement data becomes much easier.
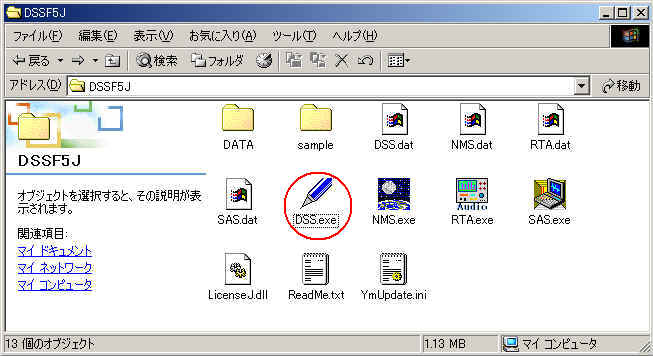
Run the DSS.exe and click the Reference button.
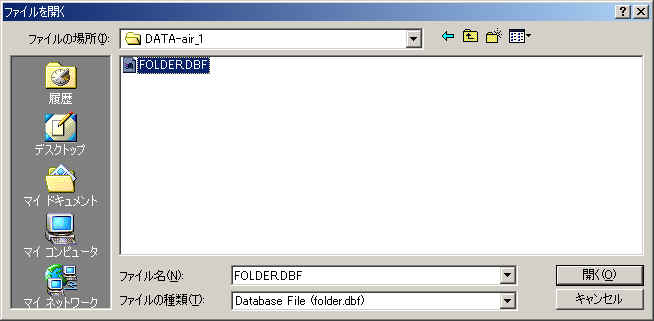
Specify the measurement data folder, then the file FOLDER.DBF is displayed. Select this file and click the Open button.
Click the OK button. Now the data in the specified folder is used by Realtime Analyzer and Sound Analyzer.