| TOP | STORE | DSSF3 | MMLIB | Support | Contact Us |
This manual is written for beginners, aiming at learning step-by-step how to measure the impulse response. We hope some opinion and advice in the manual would help you to operate the software correctly. Following Q&As and measurement example might be more helpful.
Related Q&A
It would be appreciated if you could let us know your opinion and advice about this manual. Please contact us by email.
Contents
1. Introduction
When the sound is emitted from the source in a room, the direct sound reaches to the listening point first. Then, the reflective sounds from the walls and the ceiling arrive. Finally, the sound waves which repeated multiple reflections on the surrounding walls reaches as reverberation. For example, when the impulse (a very short sound with a flat frequency response) is emitted from the stage of a concert hall, the time series of the reflected sound is recorded at the audience seat. This is called "impulse response". The impulse response contains the important information about the acoustical properties of a room.
Impulse response is widely used for investigating the acoustical properties of sound fields, such as concert halls, recording studios, and listening rooms. Once the impulse response is gained, the transfer function (frequency response function) between the sound source and the listening point is obtained by the Fourier transform. From them, many valuable indices, such as the reverberation time and the absorption coefficient of walls, are calculated. The impulse response is also used for the auralization (virtual acoustic reality) and the variety of sound effects, by using the well established convolution techniques. Realtime analyzer is the ideal software for measuring the impulse response of the concert hall, listening room, and the audio equipment.
2. Features of RA's impulse response measurement
*1. SA (Sound Analyzer) is not included in RAL, DSSF3 Light, and DSSF3 Realtime Analyzer. Use RAD, RAE, DSSF3 Full-system version, and DSSF3 Environmental Noise. See the function list to know more about available functions in the products.
*2. These functions are only available in the latest version of RA (Ver.5.0 or later). Check the version of your program in Help menu > Version Information. If you want to upgrade to the latest version, contact us via e-mail ymec@ymec.com.
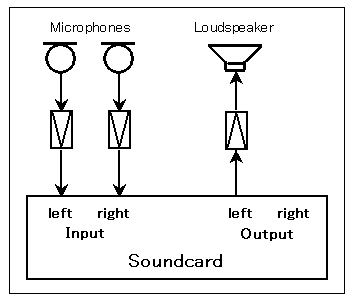
Connect the microphones and loudspeaker to the Input and Output of your soundcard as shown in the figure below. The binaural impulse responses can be measured if you use a pair of two microphones, but the monaural impulse responses can be measured by only one microphone. Remember to connect the loudspeaker to the left channel, because the measurement signal is outputted to the left channel.
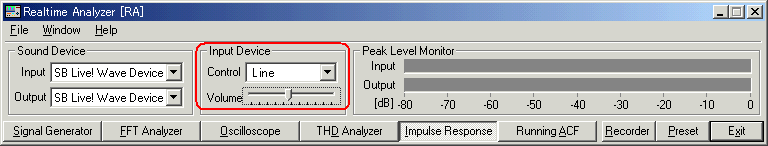
3-2. Input device setting and volume control
First, select the input device (line, microphone, etc) and sound device (soundcard) in the main window of RA. This selection is interlocked with Windows' recording control. Usually, line-in or microphone is used.
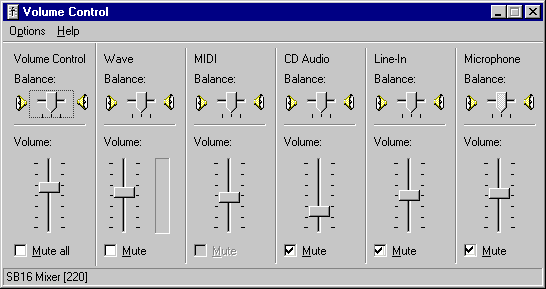
Next, output device has to be set as follows. Open the Windows Volume Control and check Mute except for Wave. Otherwise, input signal from the microphone or the line-in is outputted directly and the howling might occur. Also, do not use the advanced controls, especially the tone controls. If there are excessive sound effects, it cannot be measured correctly. Enlarge the volume as much as possible in the range which is not distorted. Distortion is fatal in a measurement system.
If you still have problems, it is difficult to perform the impulse response measurement by your PC. Please contact us. Perhaps we can give you suggestions depending on your situation.
3-3. Configuration of the measurement conditions
Basically, the measurement can be performed correctly by the default setting. Very clean impulse response can be obtained using a standard computer, soundcard, and microphones. Once you confirmed your PC works well, it is better to preserve the setting until the measurement ends. Impulse response measurement requires all the equipments to work well together. If you change the settings, it is difficult to reset them just before the measurement.
If you find difficulties, follow the instructions below.
The important settings in RA for the impulse response measurement are Sampling Rate, Measure Time, and Summation. It is briefly explained in the following.
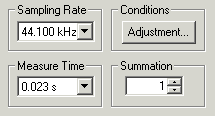
Sampling Rate
Select as much high sampling rate as possible. RA works with up to the maximum
sampling rate supported by the soundcard. But generally, 44 kHz or 48 kHz is
enough.
Measure Time
To measure the impulse response correctly, measurement time should be set longer
than twice of the reverberation time of a room. The longer the Measure Time is
set, the more the Signal to Noise (S/N) ratio is improved.
Summation
Background noise has no regularity in time, so the summation does not increase
its sound level, while the level of the impulse response is increased by the
synchronized summation. Consequently, the S/N ratio is improved. When the
summation is set to 2 or 4, the S/N ratio improves 3 or 6 dB, respectively.
However, note that the total measurement time becomes long, when the larger
number of summation is executed. If the obtained impulse response is noisy, we
recommend to try TSP method rather than M-sequence (MLS).
3-4. Adjustment before the measurement
The following adjustment is not necessary if you can measure correctly. If you find difficulties, follow the instructions below.
RA has a function to check the measurement conditions. If it were not good, it can be adjusted automatically. Click the "Adjustment" button on the Impulse response window to open the Adjustment dialog as a figure below. Items to be checked are "Input Output Level", "Mic. Position", and "Measuring Time". They are displayed OK when the settings are correct.
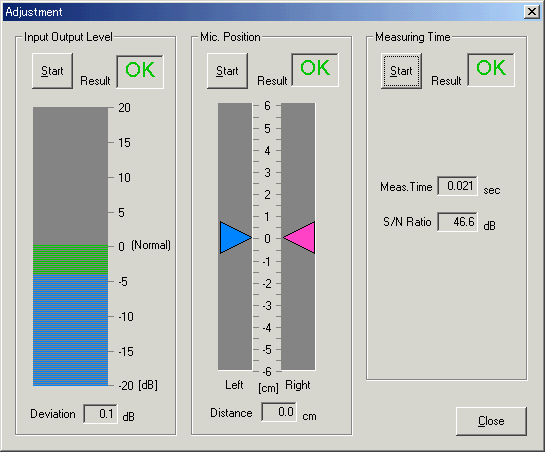
Input Output Level
It is checked whether the input and output sound level is in the proper range.
If it is not displayed OK, check the following problems.
First, adjust the volume of each equipment and retry the check. If OK still does not come out, suspect the distortion and lower the reproduction volume in the volume control. When the Auto Level box (on the Impulse response window) is checked, the software outputs the measurement signal as 70 % of the maximum volume.
Mic. Position
When you perform the stereo/binaural measurement by using the dummy head, the
head should be directed to the sound source precisely. If you are using a pair
of microphones without the head, two microphones should also be placed at
exactly the same distance from the sound source. In this test, the levels from
two microphones are checked. Adjust the position and direction of the
microphones until it is displayed OK.
Measuring Time
If the necessary measuring time is not clear, it can be checked by this test.
The proper measuring time is decided based on the S/N ratio. In the actual
measurement, set the longer measuring time than suggested.
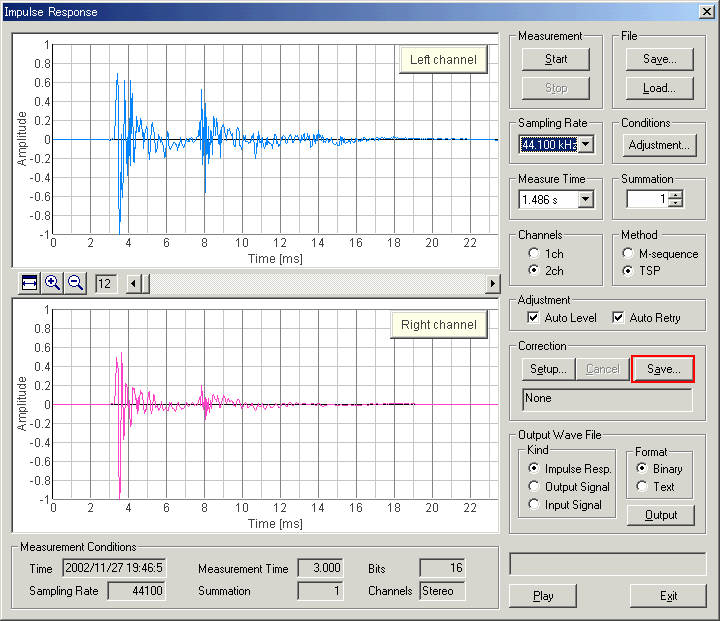
Select the Channels (1ch or 2ch) and Method (MLS or TSP), and click the Start button to start the measurement. Test signal is generated and the impulse response is measured automatically.
The example as shown in the figure below is the impulse response of the output signal itself, measured by selecting the input device as Wave. In this case, the signal is inputted without any external device. So the result should include only one pulse and elsewhere should be flat. Otherwise, the settings of the input device and the volume control might be wrong.
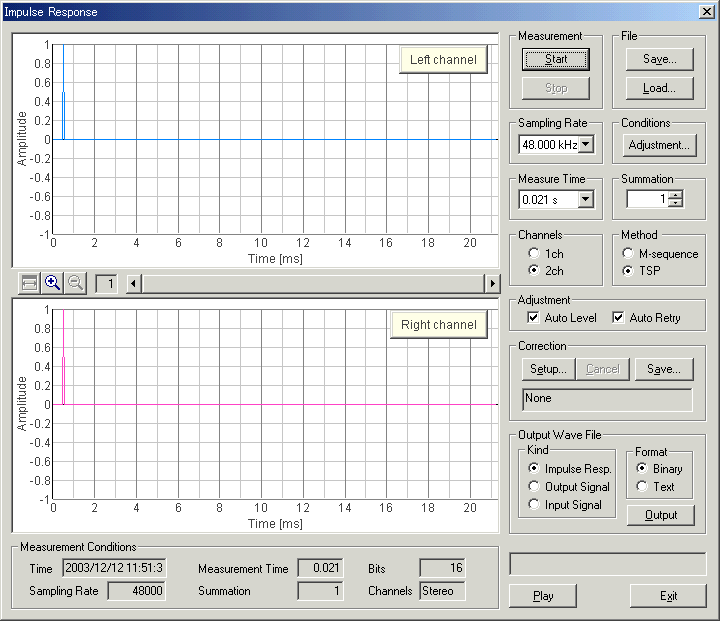
Click the Play button to listen to the measured response. By listening to it, the problem of the measurement which is not known only by seeing a waveform may become clear.
3-6. Loading the measurement data, importing the database
Click the "Load" button to load the impulse response which has been already measured and saved in the database. On the "Load Measurement Data" dialog, select the folder and data from the list, and click the Load button.
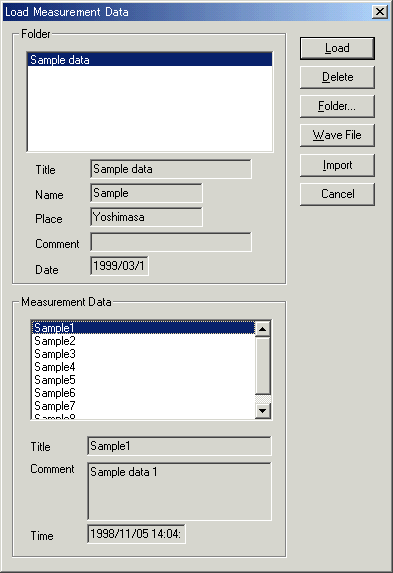
Also, the WAV file can be loaded by clicking the "Wave File" button.
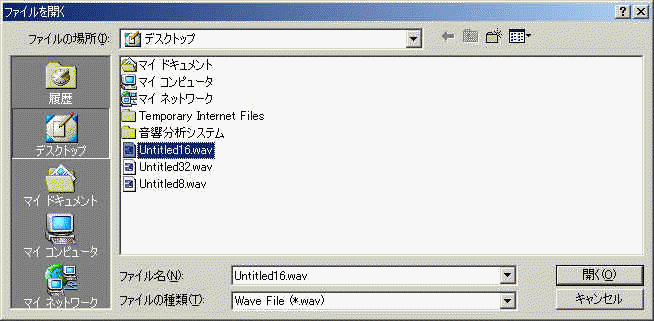
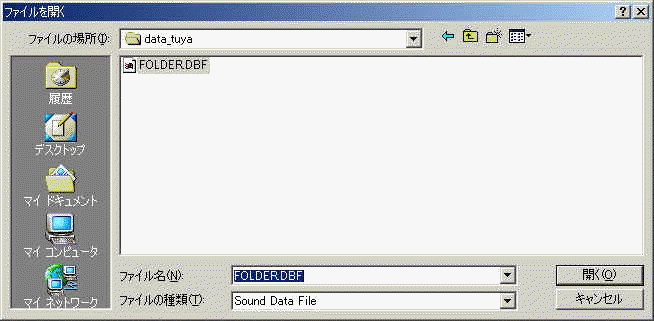
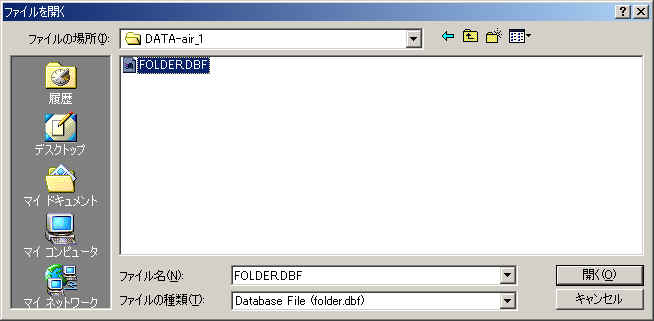
On the "Load Measurement Data" dialog, click the "Import" button to load the measurement database. When selecting the folder in which the measurement data is saved, a file "FOLDER.DBF" is displayed. Select this file and click the Open button. By this operation, the previous measurement data is added to the current database. It is useful for comparison of different measurements at a time.
Once the impulse response is measured, it can be saved to the database. The acoustical parameters can be calculated by using SA (Sound Analyzer).
*See the SA program manual for how to analyze the impulse response.
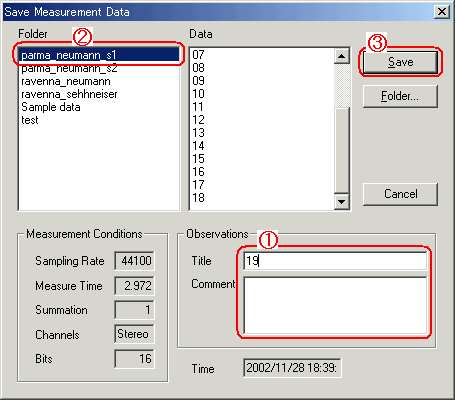
Click the "Save" button on the Impulse response window, then the "Save Measurement Data" dialog opens as below. To save data, 1) enter the title and comment on the data, 2) select the folder, and 3) click the "Save" button. If there is no folder, or you want to save data in a new folder, you can create a new folder. See below.
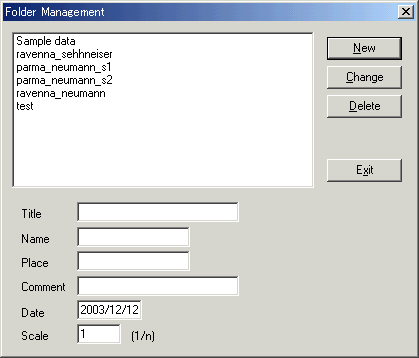
When you make a new folder, click the "Folder..." button on the Save Measurement Data dialog. Folder Management dialog opens as in the figure below. Enter the folder title and click New button.
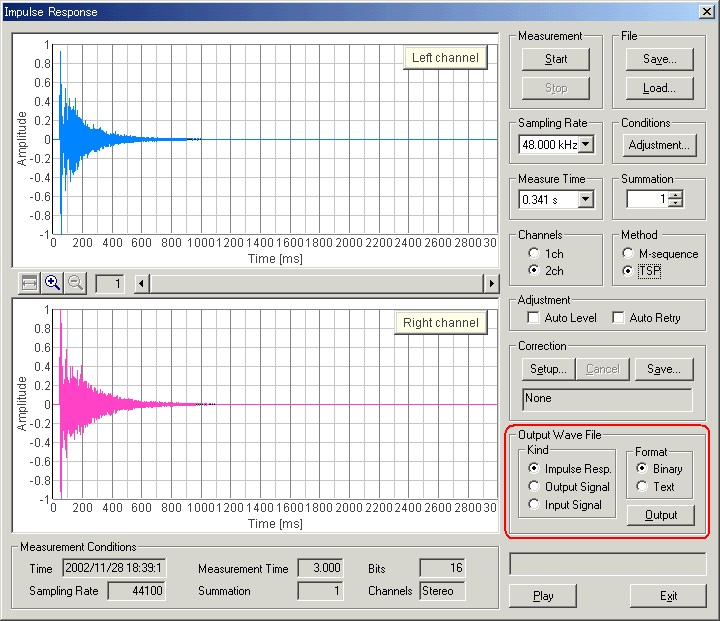
Also, the measured response can be saved as a WAV format. See the "Output Wave File" on the Impulse response window. Select "Impulse Resp." and "Binary", click the "Output" button. Output signal and input signal used during a measurement can also be saved. Saving data as a text file is also possible.
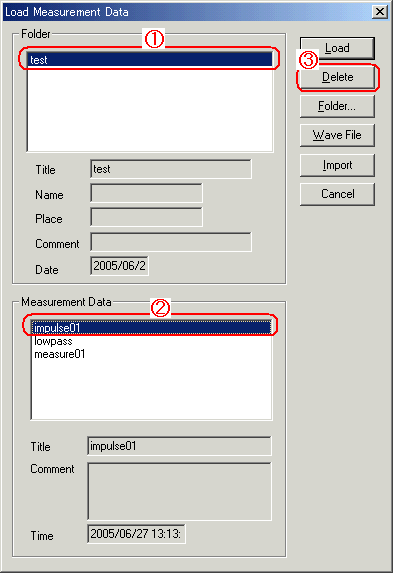
3-8. Deleting measurement data
Click "Load" button. Folder and Measurement data are displayed. To delete a
specific data in a specific folder, 1) select the folder and 2) select the data,
3) then click the "Delete" button.
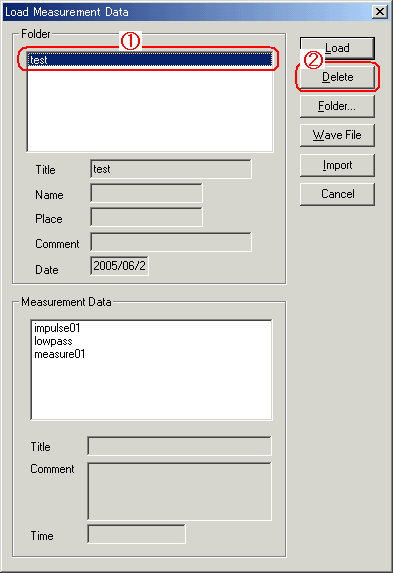
To delete a whole folder, 1) select the folder and 2) click the "Delete" button.
Measurement data of Realtime Analyzer, Sound Analyzer, and Environmental noise Analyzer, and the related data such as the microphone calibration data, the inverse filter, and the noise source template, are stored in the common database. Below, it is explained how to manage the measurement data and delete the stored data.
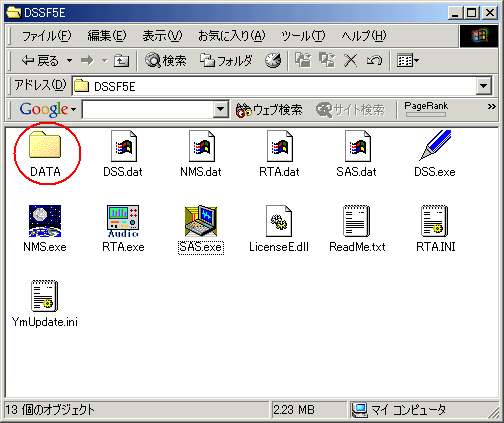
All of the measured data and the microphone calibration data are stored in the DATA folder in the program folder (e.g. DSSF5E). The database of DSSF3 is 64-bit, and the maximum data size of 2000 GB can be stored. The database of RAE, RAD, and MMLIB is still 32-bit at the time of default installation, but once you install the DSSF3, these software can also use the 64-bit database.
On-line update of the program never erase the data you have stored in the DATA folder. However, when you "re-install" the program, all the data is erased, because the sample data overwrites the existing data. To protect the already stored data, you have to backup the existing data before reinstallation. How to backup data is as below.
This backup operation enables you to use the existing data after reinstallation.
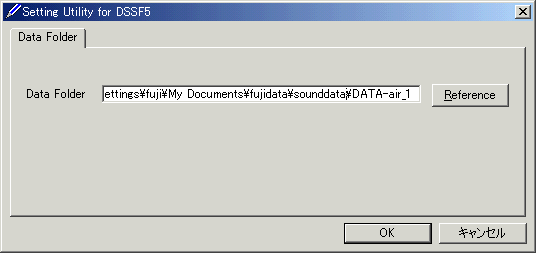
New function of DSSF3 version 5: Setting Utility to specify the data folder
In the RA series (RAD and RAE), measurement data is always stored in the "DATA" folder. To backup the data, this DATA folder has to be moved to the other location or renamed every time. But in DSSF3, this problem has been solved. If you are using the DSSF3 version 5, you can specify the data folder by using the setting utility (DSS.exe). Wherever the measurement data is saved (even in the other computer on the network), DSSF3 can use this data. By this function, management of the measurement data becomes much easier.
1. Run the DSS.exe and click the Reference button.
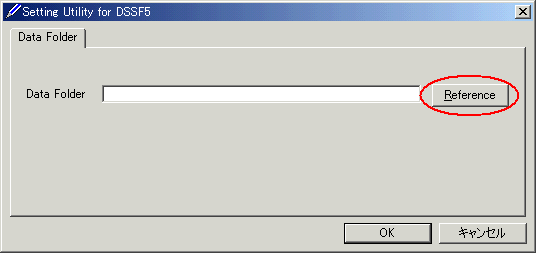
2. Specify the measurement data folder, then the file FOLDER.DBF is displayed. Select this file and click the Open button.
3. Click the OK button. Now the data in the specified folder is used by the DSSF3.
4. Tips for the advanced measurement
4-1. Using the measurement support functions
This software is equipped with the measurement support functions, such as Auto Level and Auto Retry. If these functions are used, measurement quality is checked and repeated until a good result is obtained. However, in a normal condition, clean impulse response can be measured with these settings off.
Auto Level
When using this function, the input and the output level is adjusted by the
short test signal. Then the measurement signal is outputted to measure the
impulse response. If you do not use this function, adjust the output volume in
the Windows volume control. Normal output volume range is around 70% of the
maximum.
Auto Retry
When using this function, the measurement is repeated twice. Cross-correlation
of these two measurements is calculated and the time delay of its peak is
checked. If the time delay is large (i.e. two measurements are shifted in time),
measurements are repeated until it passes the check.
4-2. Frequency compensation by the inverse filter
It is ideal if a quality microphone and a loudspeaker are used. However, even if it is difficult to use such superior equipments, the measurement accuracy can be improved in RA by using the correcting function.
Correction of the measurement system by the Inverse filter
The response of the measurement system itself (including microphone, amplifier, loudspeaker, and PC), can be compensated by creating the inverse filter. By removing the response of the measurement system, the correct response of the sound field can be measured. Procedures for creating the inverse filter is described below.
To create an inverse filter, measure the impulse response close to the loudspeaker. This is to remove the effect of room. Impulse response just after the direct sound represents the response of the measurement system.
1) To create an inverse filter, place the microphone close to the loudspeaker and measure the impulse response. Then, click the "Save" button for "Correction". The "Save Filter" dialog opens.
2) In the "Save Filter" dialog, responses of the loudspeaker and the microphone is cut. Select only the direct sound from the impulse response. Input the Maximum Level which should be compensated. In this example, this value is set to 30 dB, but there is no limit. However, note that so large peaks or dips in the frequency response could not be compensated. After the adjustment, enter the title and comment, and click the Save button.
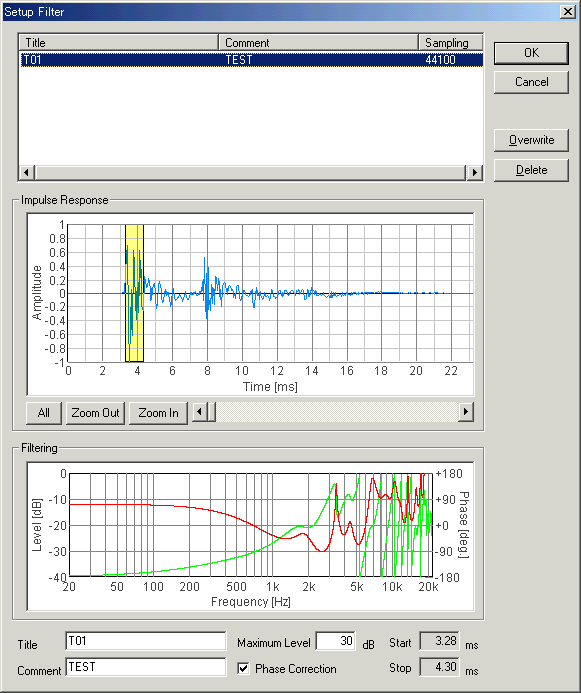
3) Click the "Setup" button for correction. "Setup Filter" dialog opens. Select the filter and click the OK button.
4) Then, start the measurement again. You will see the response of the measurement system is now removed.
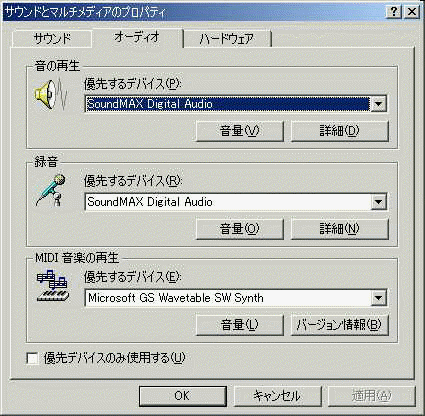
4-2. Check of Sound and Multimedia property
For the impulse response measurement, more attention is needed for the settings of sound driver than in other measurements, because the impulse response measurement needs the synchronization of input and output. If you have any trouble in the measurement, check the version of the sound driver first. We recommend to use the latest version of the driver. Then check the following settings.
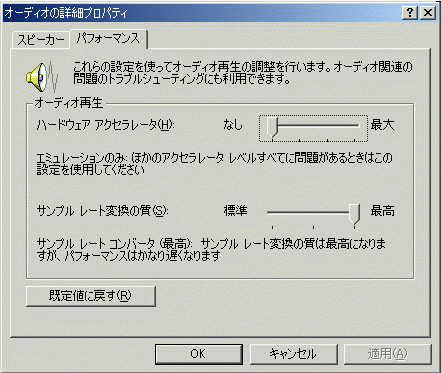
Open the Sound and Multimedia Properties control panel and click the "Advanced" button. (Sorry that the images below are of Japanese OS)
Open the Performance tab, set the "Hardware acceleration" to None and the "Sample rate conversion quality" to Best.
Measurement examples by RA can be seen in the Introduction to Sound Measurement. For the impulse response measurement, see the following:
Measurement of PC's soundboard by RA 5
| Y Store. |
| TOP | STORE | DSSF3 | MMLIB | Support | Contact Us |
If you have questions or comments about this
page,
feel free to contact us by email ymec@ymec.com
or by online
inquiry form.