| TOP | STORE | DSSF3 | Mmlib | Support | Contact Us |
|
|
1. Basic measurement procedure
When measuring sound, the analog signal is first converted to the digital signal in the soundboard. Then, the digital signal is put in the mixer device in Windows and is taken in to RA. When replaying the test signals created in RA's signal generator, the signal passes the same course in the opposite direction. Windows' sound control program (volume control) is used to select the input / output device and to adjust the volume. Learn more about PC's audio function and necessary devices for sound measurement.
Input/output device setting and volume control
Signal output: RA outputs the digital signal (WAVE signal) to the Windows sound mixer. Output volume is adjusted by the Windows volume control.
Open the Windows volume control (Playback). Check the Mute except for WAVE.
Another important function to control the output volume is "Digital Output" in the signal generator. This volume adjusts the range of the digital signal, to make the signal not to be distorted. It is important to remember that many soundboards' performance becomes poor around their maximum output level. Before the measurement, it is highly recommended to check the distortion of the output signal (Adjustment before a measurement).
Select the input device in the main window of RA. To measure the signal generator's output, select WAVE/DirectSound as below.
In the actual measurement, "line" is used as the input device. If your PC does not have the line-in terminal, microphone input terminal can also be used. But note that the quality of PC's mic-in terminal is not good in general. Alternatively, a soundcard with USB or PCMCIA interface is available. See this page Additional devices for sound measurement for information of the recommended equipments. Adjustment of the input volume is done by the Windows volume control or by the volume control in RA's main window. These two controls are interlinked for ease of use.
1-2. Measurement by the oscilloscope
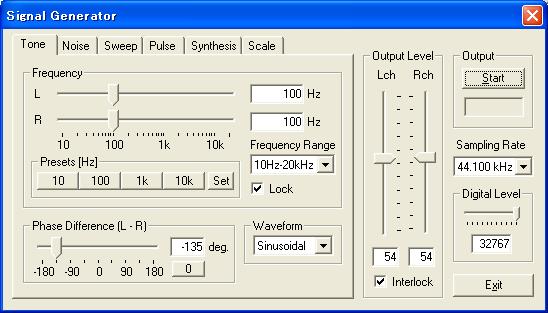
In the signal generator, four kinds of waveforms (sinusoidal, triangle, square, sawtooth) can be created with an arbitrary frequency. The oscilloscope can display the waveform of the input signal as below. The signal generator and the oscilloscope can be used to see how the signal is changed when the signal goes through some devices. This is the most basic test in general audio applications, for example, for checking the audio device's operation, diagnosing, and evaluating its performance.
Connect the output of the soundcard with the input terminal of an audio device (e.g. amplifier). Then connect the output terminal of the amplifier with the input of the soundcard. In this configuration, the signal from the PC goes to the amplifier and comes back to the PC. Now, by starting the signal generator and the oscilloscope, the output of the amplifier can be measured. You can see whether the signal is correctly amplified, whether the signal is distorted or not.
The oscilloscope shows the waveform of the input signals in real time. Difficult settings can be ignored at first. By just clicking the Start button, the signal is triggered and the level range is adjusted automatically, and the waveforms are displayed in the proper positions. Snapshot of the measurement screen can be easily taken by the Screen Copy button. Automatic over sampling is applied to the signal to display the smoothed waveform especially for the short sweep time range.
Application notes:
1-3. Measurement by the FFT analyzer
FFT analyzer is a powerful tool for measuring sound in real time. Spectrum, Octave band, Waterfall, and Correlation meter can be used with the signal generator as follows.
Sinusoidal (sine) tone is the most basic test signal. By feeding a sine tone to an audio equipment and measuring its output by the power spectrum, you can see whether the signal frequency is correctly transmitted. Extra components would appear if there is some problem.
This is a very important test for checking if the audio system is working correctly. It is also very effective for the diagnosis and maintenance of the system. Abnormalities such as distortion, oscillation, noise, are easily detected.
Figures below show the power spectrum of a 1kHz sine tone. Both channels measure the same signal, but the spectra are different. It is because the output level of the right channel signal is too high. If the signal is clipped (distorted) like this, the resultant spectrum will include many harmonic components in addition to the fundamental component. It is important to know the appropriate volume settings before the measurement. Adjustment before a measurement
Signal generator (sine tone)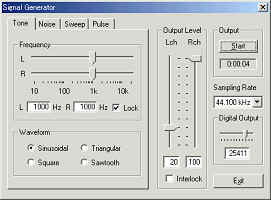 |
|
FFT analyzer (spectrum)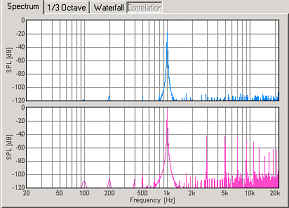 |
By using the noise generator and the power spectrum, frequency response of the audio equipments is measured. The figure below is a result of the measurement for the signal generator's output itself. This is done by selecting the "wave" as an input device, starting the output of white noise in the signal generator, and starting the spectrum analyzer. If you connect the PC's output to the external device and measure its output, the frequency response of the device is easily measured.
Signal generator (white noise) |
|
FFT analyzer (spectrum) |
Application notes:
See the Audio measurement report for the measurement examples.
Next example is a combination of pink noise and the octave band analyzer. Pink noise is similar to white noise, but the energy decreases in relation to its frequency. In audio measurement, pink noise is more popular than white noise, because white noise is sometimes dangerous for loudspeakers due to its high energy in the high frequency ranges. To measure the frequency response by use of the pink noise, the octave band analysis is used. As shown in the figure below, the octave band spectrum of pink noise becomes flat.
Signal generator (pink noise) |
|
FFT analyzer (octave band) |
Octave band analyzer can also be used for measuring environmental noise. Limited function of the standard sound level meter can be greatly extended.
Application notes:
Operation of Sound level meter 2
Next, sweep signal is measured by the waterfall display. Waterfall is the three dimensional expression of a time series of the power spectrum (time-frequency-energy).
Signal generator (sweep) |
|
FFT analyzer (waterfall) |
The combination of the sweep signal and the waterfall measurement is a useful tool for checking the dynamic characteristic of loudspeakers. It is quite effective for measuring the dynamic characteristics of the loudspeaker with the crossover network. Frequency response curve can be drawn by the sweep signal too. See the following application note.
Sweep generator and Frequency response measurement
By using the correlation meter, time delay between two input channels can be measured. In the figure below, "monaural" pink noise was measured by the cross-correlation function. No time delay is found.
| Signal generator
(pink noise - mono)  |
|
FFT analyzer (cross-correlation)  |
For more information, see the Speaker phase check in the Introduction to sound measurement.
2. Adjustment before a measurement
If the Realtime Analyzer is used without any adjustment, performance of the sound device (noise, distortion, and frequency response) of your PC affects the measurement. It may become critical when you use the built-in sound chip, because most of them do not have sufficient performance for sound measurement. It is important to check the sound performance of your PC and adjust it correctly before the measurement. It is also helpful to understand the internal mechanism of PC's sound device and the functions of the software.
2-1. Distortion measurement and volume setting
If you do not check the settings of RA, the output signal of the signal generator may be distorted. Distortion of the test signal is very harmful for the measurement. Correct results never be acquired, and it may break the equipment under test.
In most cases, the most problematic device is the analog amplifier built in the D/A converter. The 16 bit D/A converter transforms the amplitude of the digital signal (1-32767) to the analog signal. But this output signal is distorted in most PCs' sound chip around the maximum output level. To reduce such a distortion, digital volume should be adjusted. Digital volume is called as "Digital Output" in RA as shown in the signal generator.
Decreasing the digital volume suppresses the maximum digital output. Demerit of decreasing the digital volume is that a dynamic range and resolution decrease, but it is far better than the sound is distorted. This is the very important point for the correct sound measurement.
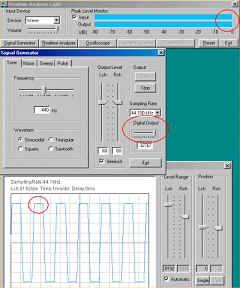
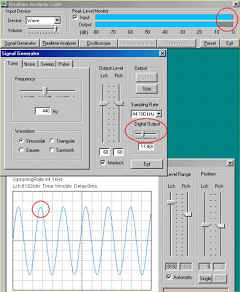
To check a distortion, generate a sine wave in the signal generator (hereinafter referred to as "SG") and observe its waveform by the oscilloscope. A 1 kHz sinusoidal tone is recommended as a test signal.
A test signal generated by the SG (tone, noise, sweep, and pulse) is the digital signal that is called "wave out". To observe the signal by the oscilloscope, select WAVE as the input device. The name of the device depends on the environment (e.g. WAVE, mixer, directsound, and so). The SG only outputs the signal. It does not control the input device. To adjust the input volume, check the peak level monitor (right side in the figure below) and move the Volume slider (left side). Recommended output level is below -5 dB.
In this test, a test signal generated by the SG is converted to analog (by D/A converter), then fed to the oscilloscope via Windows mixer. The whole measurement chain is completed only inside the PC.
When the waveform is collapsed in the oscilloscope, check the volume control on the RA's main window first. If the input volume is too large, the sine wave becomes like a square wave. Next, adjust the Digital Output in SG until the clean sine wave appears. In the oscilloscope, the adjustment result can be seen on time. It tells the proper volume setting more simply than other methods.
 |
 |
more info: About Windows volume control and RA's volume setting
more info: Introduction of test signal CD
2-2. Measurement of the frequency response of PC's sound device
Next, the frequency response of the soundcard is measured by using the pink noise and the octave band analyzer. Leave the configurations as in the previous measurement, and output the pink noise on the SG.
The figure below is the 1/3 octave band analysis of the laptop DELL INSPIRON 7500. The vertical axis is zoomed in between -10 and -60 dB. The sound level is expressed by the relative level with the maximum input as 0 dB. In general, the tolerance level of the frequency response is about -3 dB compared to 1 kHz. The sound device of this PC has a problem. The power at the high frequency range above 5 kHz decreases heavily. It means that when this PC is used for the measurement, this frequency response is added to the test signals at the level of the D/A converter. INSPIRON 7500 is a PC for the business use, so the high frequency sound might be decreased intentionally to pretend as a high-grade sound.
Of course, there is a PC with a good performance D/A converter. The important thing is that the sound device is not controlled intentionally by the maker.
The following picture shows the frequency response of DELL INSPIRON 5000. This PC has a relatively flat frequency response among DELL laptop series. It is thought that the frequency response compensation works fine for this level of attenuation. How to compensate the frequency response is instructed below.
Next picture shows another INSPIRON 7500. It is not suited for the sound measurement because the attenuation in the high frequency is so large. Even the compensation is still possible, it's quality is limited. If you want to perform precise measurements, you should use the PC with the high quality sound device or use the external sound device (see the device selection guide).
Next, the pink noise is generated on the other PC (Sony VAIO PCG-R505R), and its headphone output is connected to the DELL's line input. In this case, the measurement result reflects the response of output and input. The result below shows that both of the VAIO's headphone- out and DELL's line-in have the flat response.
Measurement of the PC's sound device is the starting point of the sound measurement. All measurement can be performed if you can measure your PC correctly. If the performance of your PC's sound device is not good, we recommend you to use a high quality soundboard to perform the correct sound measurement.
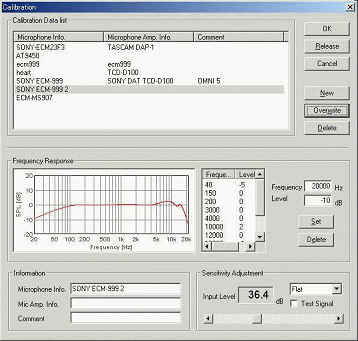
Before starting the measurement, it is highly recommended that the microphone settings are stored in RA as a calibration data. Several settings such as the sensitivity, the frequency compensation curve, and the input volume are saved at the time of calibration. Once it is saved, these settings are automatically recovered so that RA enables the measurement with the same condition at any time. To use the already stored calibration data, just select the microphone data on the calibration window of the FFT analyzer.
For the measurement of the absolute sound level, an input level of the microphone should be calibrated by using the sound level meter or the acoustic calibrator as reference. A 1 kHz sine tone is typically used as a calibration signal. The calibration procedure is described as follows.
| 0) | Connect the microphone and the loudspeaker to the soundcard. Confirm that the signal input/output is possible. |
| 1) | Open the FFT analyzer and click the Calibration button. Calibration
window opens. If you already have a calibration data, select the data and
click the OK button. If not, go to the next step.
|
| 2) | Click the Edit button. Edit window opens.
|
| 3) | A) Using the sound level meter (SLM)
A-1) Place the SLM and the microphone closely to the sound source (loudspeaker), set the frequency weighting curve of the SLM as FLAT, and output the test signal (1kHz sine tone) by checking the "Test Signal" box. A-2) Set the volume of the input device (see the main window of Realtime Analyzer) so that the peak level monitor reaches around -15 and -10 dB. A-3) On the calibration window, set the frequency weighting curve as FLAT, and adjust the sensitivity scrollbar until the Input Level matches the reading of the SLM. B) Using the acoustic calibrator B-1) Attach the calibrator to the microphone, and turn it on. B-2) Set the volume of the input device so that the peak level monitor on the RA's main window at between -15 and -10 dB. B-3) On the calibration window, set the frequency weighting curve as FLAT, and adjust the sensitivity scrollbar until the Input Level matches the reference sound pressure level of the calibrator (e.g. it is typically 94 dB or 114 dB at 1000 Hz). C) Measuring sound by the sound level meter as a microphone The sound level meter itself can be used as a microphone. See 4-1. Connect the sound level meter with PC for how to connect the sound level meter with PC and calibrate its sensitivity. |
| 4) | Enter the Microphone Info., Mic Amp. Info. (optional) and Comment (optional), and click the New button. It appears on the calibration data list. To use the stored calibration data, just select the microphone data from the list. |
3-2. Frequency response compensation of microphone
If you have the microphone's frequency response data provided by the manufacturer, it can be compensated on the calibration window. Follow the instruction below to make a microphone compensation data.
Note: Microphone compensation is recommended only for the frequency response measurement by using pink noise or white noise. It is because the amplitude spectrum (i.e. frequency response) can be compensated, but the phase spectrum (i.e. transient response) can not be compensated. Ideally, the microphone should have a flat frequency response and transient response to capture sound accurately, but generally it is not. Most microphones are adjusted so that they have balanced frequency response and transient response. If only the frequency response is compensated, its transient response is distorted. It is no problem for measuring the stationary sound such as pink noise and white noise, but it causes problems for measuring the transient sound (music, speech, etc.).
| 1) | Open the FFT analyzer and click the Calibration button. | ||||||||||||||||||||
| 2) | Calibration window opens. Click the Edit button. | ||||||||||||||||||||
| 3) |
Edit window opens. Frequency Response curve on this window can be edited by entering the frequency and its level. For practice, select 10000 Hz from the list, enter 5 (dB) in the Level box, and click the Set button. Then the frequency curve changes as in the figure below. Only four frequencies of 10, 100, 1000, and 10000 are appeared in the list, but you can add the new frequencies by entering the frequency and its level in the boxes and clicking the Set button. 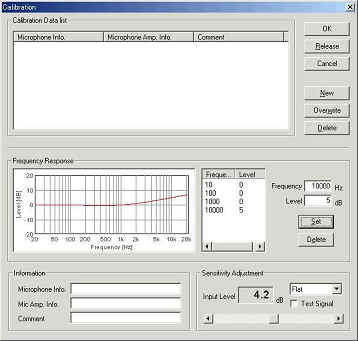 |
||||||||||||||||||||
| 4) |
Edit the frequency response curve to match those of the microphone.
|
||||||||||||||||||||
| 5) | Enter the Microphone Info., Mic Amp. Info. (optional) and Comment (optional), and click the New button. It appears on the calibration data list. To use the stored calibration data, just select the microphone data from the list. |
As for other example of microphone compensation, see the following pages.
Audio measurement report 4 (Compensation of the frequency characteristics of a microphone)4. How to use a sound level meter
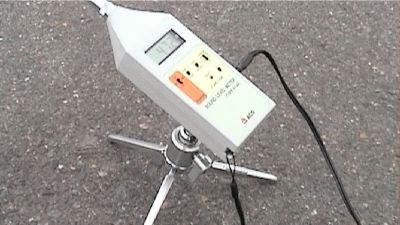
The sound level meter (SLM) can be used as a measurement microphone, if it has the AC analog output. AC-OUT of the SLM is an amplified sound itself. It is same as measuring with the microphone and microphone amplifier. Realtime Analyzer significantly extends the function of the standard sound level meter.
In the FFT analyzer, frequency weighting filters (Flat, A, B, C) are easily
chosen. The spectrum analyzer and the octave band analyzer are equipped with the
peak hold function and the smoothing function including the standard time
constant of slow: 1.0 s and fast: 0.125 s. Also, the microphone calibration
function is available. By setting these conditions properly, the FFT analyzer
can be used as a highly advanced multi-functional sound level meter.
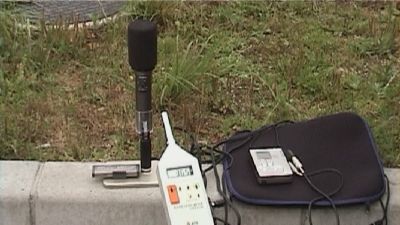
4-1. Connect the sound level meter with PC
When you connect the sound level meter's AC-OUT and PC's line-in jack, you need a stereo mini jack cable and a micro plug to stereo mini plug adapter.
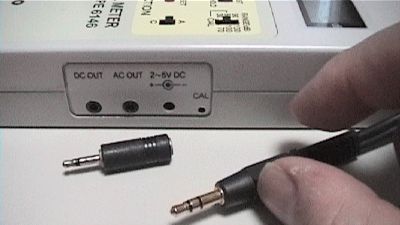
Set the input device to "mixer" or "line-in".
This is Windows volume control (output). Unnecessary devices (LINE or MIC) should be mute. If you don't do this setting, howling may occur during the measurement.
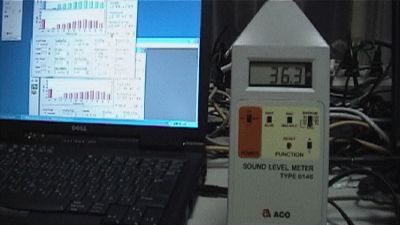
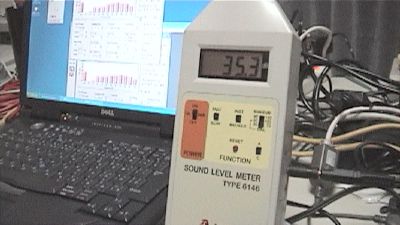
When you use a sound level meter, note that the measurement range is divided into several modes. For example, ACO sound level meter Type 6146 has three measurement ranges. Maximum level of each range is 70, 100, and 130 dB and its dynamic range is 40 dB. If the dynamic range of sound to be measured exceeds 40 dB, it could not be measured correctly.

The important thing is to calibrate the input level so that it can record a sound with a sufficient level for analysis. For this purpose, it should be calibrated with a test sound close to the sound level to be measured. Test sound should have a fixed volume during the calibration. Then it is easy to match the input level of RA with that of a sound level meter.
This is a calibration window. Confirm that the frequency weighting (A, C, or Flat) of RA and the sound level meter is same. Adjust the input level to match the sound level meter reading.
Even if it is calibrated firmly, the sound level measured by RA might be different from a sound level meter. This is not a mistake. One reason of such a difference is a mismatch of FFT size, sampling rate, smoothing size, and frequency weighting.
When the time constant (dynamic characteristic switch) of the sound level meter is FAST (time constant is 125 ms), set the sampling rate to 44.1 kHz, FFT size to 4096, and smoothing to 2. When the time constant is SLOW (time constant is 1.0 s), set the smoothing to 5.
Time constant of the smoothing function in the FFT analyzer can be set as
time (s or ms). The standard Fast (125 ms) and Slow (1.0 s) time window can
also be selected.
The sound level meter might have a measurement range switch. In this case, you can save several settings for each measurement range to measure a wide dynamic range.
By following the instruction above, the function of the sound level meter can be greatly increased. Moreover, we recommend "Environmental noise analyzer / EA" for long time measurement. The automatic measurement function of EA enables prolonged measurement without stress.
This is a DAT recorder (SONY TCD-D100). In the field measurement of a concert hall or the environmental noise, it was common that sound is recorded by DAT (till about 1 - 2 hours), and is analyzed later.
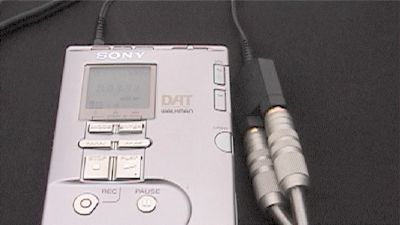
In this picture, sound is recorded by DAT recorder. If the original sound is recorded, the analysis can be redone any times and the accuracy of a measurement result is checked later. The important thing is to record a standard signal as the same recording level to remember its sound level.
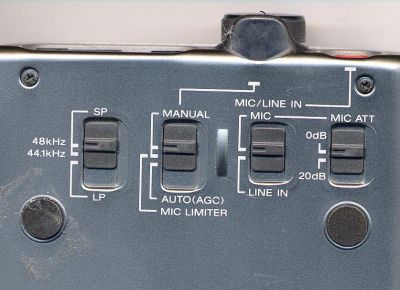
The picture below is back of SONY TCD-D100. It is important to use the recorder that is equipped with a manual recording level adjustment. If the recorder is using the automatic gain control, the recording level will be adjusted automatically during a recording. This is not good to measure the absolute sound intensity. Recording mode should be set to manual mode, and the recording level should be set slightly below the expected maximum sound level to avoid the distortion.
Even if you do not have a recording devices, RA can record a sound into the hard disk directly.
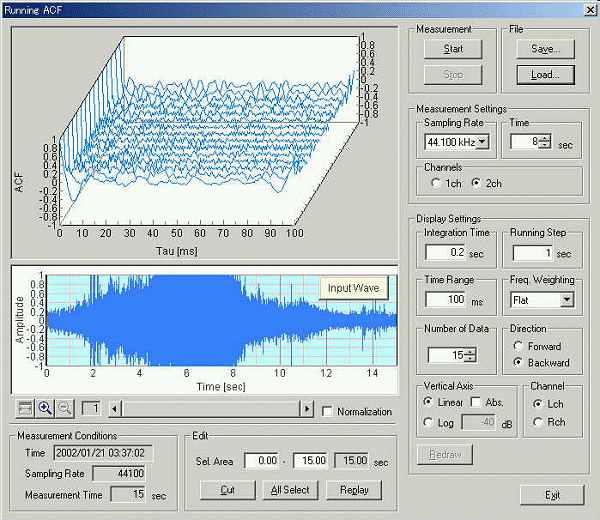
6-1. Sound recording by using the RA's ACF measurement and Environmental noise analyzer /EA
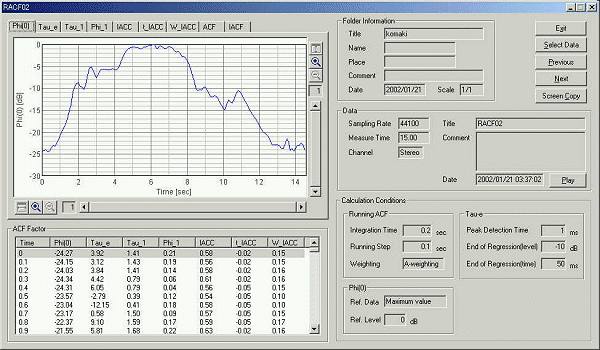
Sound recording function is equipped with the Running ACF window in RA, and the Environmental noise Analyzer /EA. In each measurement, sound is recorded automatically. When the measurement data is saved, sound file is also saved in the common database with additional information such as the measurement date and the measurement conditions.
SA (sound analyzer) is also equipped with a replay function. It is possible to play a sound by SA and analyze it by RA.
It is also possible to input and output a WAVE file. If a WAVE file is chosen when saving a file, a .WAV file can be saved directly. This file is reproducible by Windows Media Player, or can be read into the sound editing software, such as "CoolEdit". You can edit and process the sound waveform directly.
By using WAVE input/output functions, re-analysis and sharing of the data with other system becomes possible. For the high resolution analysis, just record a sound with low resolution and analysis it later. Simultaneous sound playback and measurement is also possible. For example, play the recorded sound and start the FFT analyzer. The power spectrum or the 1/3 octave band analysis is performed in real time. For this purpose, the multi task OS like Windows 2000 and XP are recommended.
6-2. Sound recorder (Available only in DSSF3)
In the new version of the DSSF3, the sound recorder window has been newly added. Sound recording up to about 10 minutes is available. Simultaneous sound playback and analysis by the FFT analyzer is also possible.
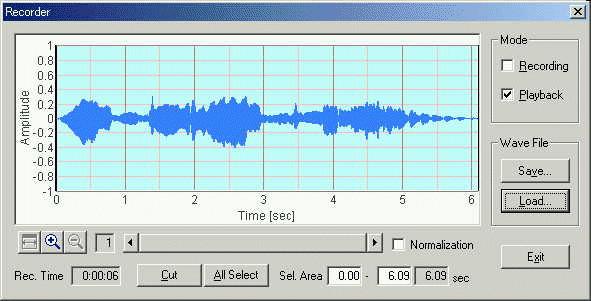
How to use the sound recorder
1) Click the Recorder button on the RA's main window to open the sound recorder.
2) To start recording, check the Recording box on the Recorder window.
3) Start one of the Signal Generator, the FFT Analyzer, or the Oscilloscope. When the FFT Analyzer or the Oscilloscope is started, the input signal is recorded. When the Signal Generator is started, the generated signal is recorded. To stop recording, click the Stop button of the window that was started.
4) To start playback of the recorded signal, click the Playback button of the Recorder window, and start the FFT Analyzer or the Oscilloscope. The recorded signal is played and simultaneously analyzed by the FFT Analyzer or the Oscilloscope.
5) Right click on the recorded waveform and drug the mouse to change the selection. Selected region is displayed in blue. Click the Cut button to cut out the selected range.
6) Click the Save button to Save the recorded signal as the wave file (.wav format).
7) Click the Load button to Load the wave file. Loaded wave file can be played and analyzed as the recorded sound.
Continued to Impulse response measurement
| Y Store. |
|
|
| TOP | STORE | DSSF3 | MMLIB | Support | Contact Us |
If you have questions or comments about this
page,
feel free to contact us by email ymec@ymec.com
or by online
inquiry form.