| Japanese | English |
 |
 |
![]() air8.wav (44.1kHz / Stereo / 15sec / 2.52MB)
air8.wav (44.1kHz / Stereo / 15sec / 2.52MB)
The ACF below shows the most exciting noise ingredient that have the minimum t1 value and the maximum f1 value.
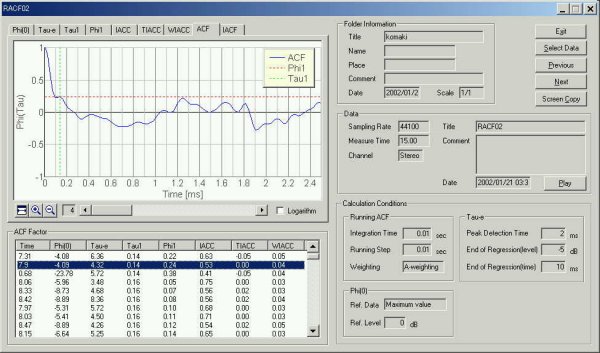
The fundamental frequency is seen at 1.22 ms that corresponds to 800 Hz. The t1 value is seen at 0.14 ms that is 7 kHz.
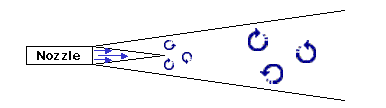
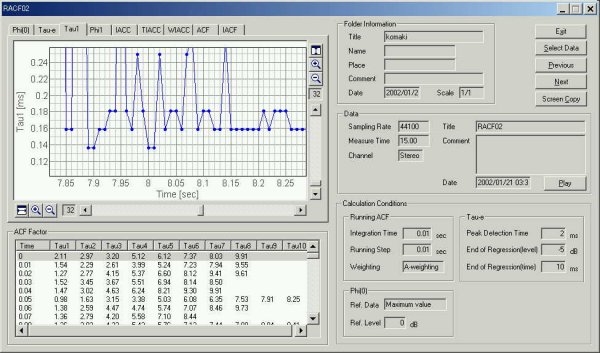
The time delay for the first peak in the ACF is defined as t1. This value shows the strongest high frequency component included in the signal. The time delay for the maximum peak in the ACF shows the fundamental frequency.
This graph shows the time change of the t1 value
between 7.8 and 8.25 seconds after the measurement started. That shows the
variation of pitch between 5.5 and 6 kHz.
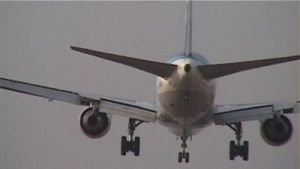
Although the engine power is suppressed to the minimum at the time of landing, that sound is the jet noise with a high sound of 7kHz. The outline of the jet noise at the time of landing is summarized as follows.
At the time of approaching to the airport, the representative (the most prominent) frequency of jet engine noise rises because of the Doppler effect. However, if it approaches more, the Doppler effect decreases and the pitch of sound falls since the difference of the direction of the plane and the direction of sound becomes large. When the plane approaches more and the body comes just ahead, there will be the sound of the fundamental frequency and the high frequency. When the plane is passing, it is influenced of both the high frequency breathed out from a jet nozzle and the decreasing low frequency by the Doppler effect. When the airplane goes away, the energy will decrease sequentially from the high frequency to the low frequency.
October 2002 by Masatsugu Sakurai