| Japanese | English |
 |
 |
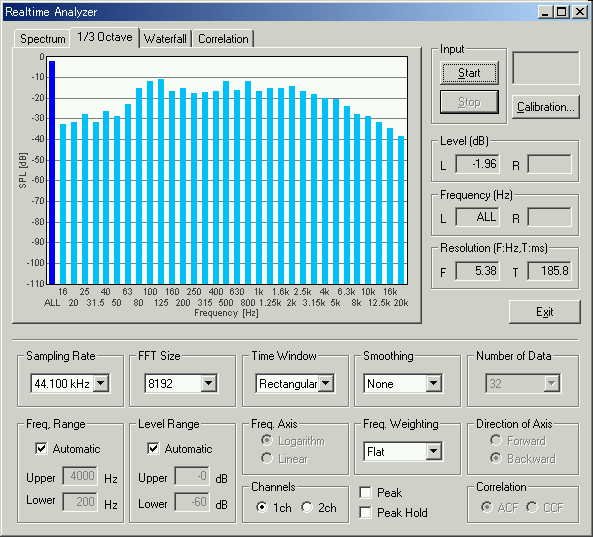
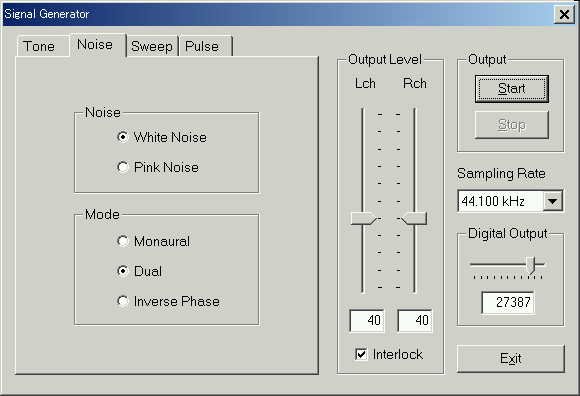
The white noise was generated by the signal generator of RA, and the 1/3
octave analysis was performed.
This is the 1/3 octave analysis of the white noise.
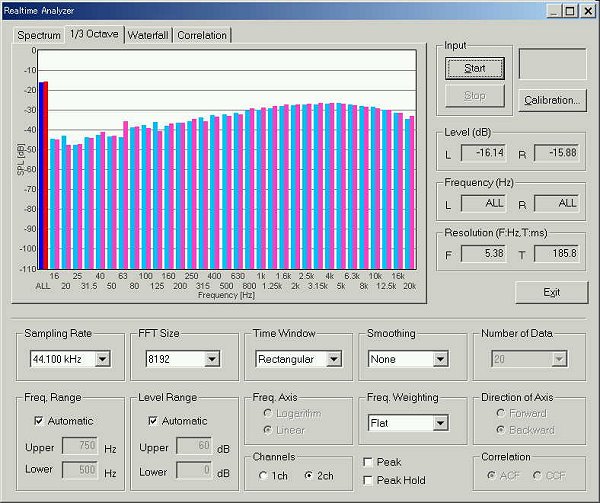
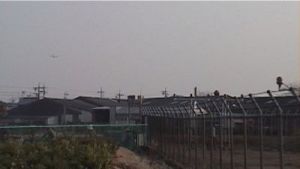
This is the power spectrum of the jet noise. The frequency range and the level
range were adjusted to make the peak frequencies intelligible.
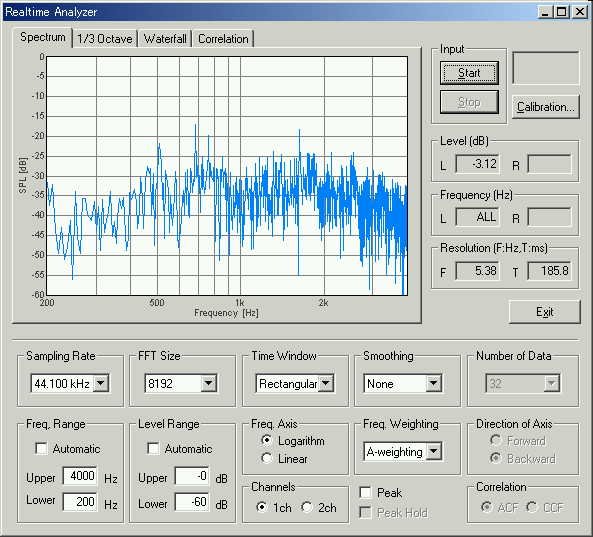
Although the noise of a jet aircraft resembles the white noise in frequency ingredient, it has a strong peak frequency around 2kHz.
This is the autocorrelation function at 1.6 second. The first peak is seen at
0.6 ms, which corresponds to the frequency of 1.7 kHz. The height of the peak
represents the pitch strength.
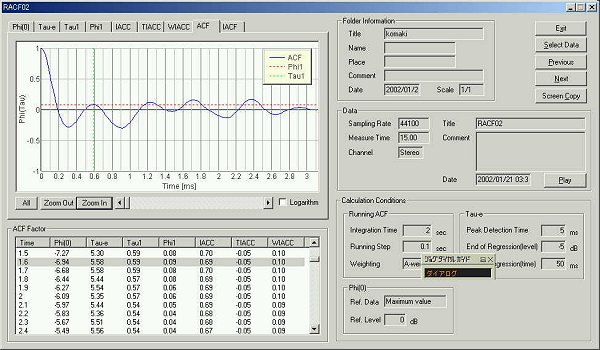
This is the time change of the first peak in the ACF (t1). The graph shows that the pitch of the jet noise changes dynamically.
The frequency between 1.5 kHz and 5 kHz might give the biggest stimulus to our brain, because our auditory system is the most sensitive in this frequency range.
The peak frequencies between 1.5 and 5 kHz are corresponding to the initial ACF peaks between 0.2 and 0.5 ms. These components are important for the speech analysis too. (See also the Analysis of the Japanese voice 2.)
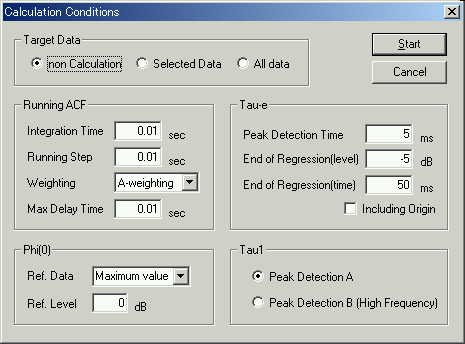
The frequency component of the jet noise is contained in the domain of a
voice signal. So, the noise was analyzed with the same conditions as
speech. Very short integration time and running step were chosen.
This is the example of the ACF. High frequency component around 7 kHz can be
seen at 0.14 ms.
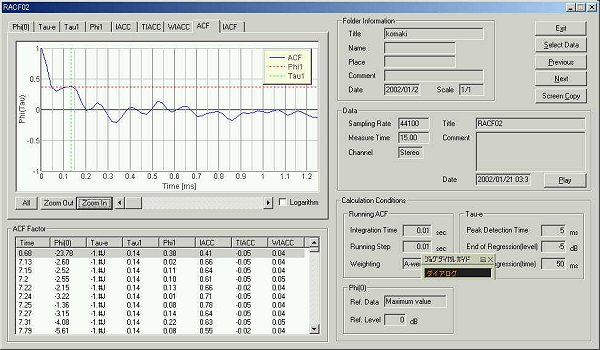
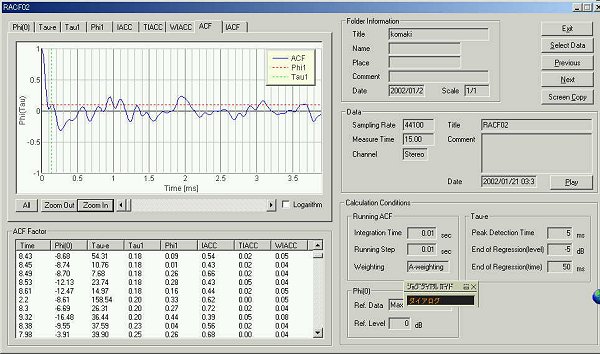
This figure contains time change of all parameters from the ACF and the IACF.
The figure is made by the screen copy function of SA. The graph of the ACF in
this figure is one measured for 0.68 seconds. In this ACF, a strong pitch
component is seen at 5 kHz (0.2 ms in the time axis).
![]() air8.wav (44.1kHz / Stereo / 15sec / 2.52MB)
air8.wav (44.1kHz / Stereo / 15sec / 2.52MB)
The influence of noise is proportional to the frequency
sensitivity on hearing. Mid frequency range (around 1k-4kHz) has the most
prominent effect. Also the higher and the stronger pitch component have
much effect. Sudden change of the sound level, pitch frequency, and pitch strength
may also have much power as noise.
The purpose of our measurement system is to analyze noise in detail. This system was developed with supports of JST (Japan Science and Technology Corporation).
[Reference]
ACT-JST web site
Research and Development for Applying Advanced Computational Science and
Technology
R & D Results Information
Short Type
(period: One-Year)
Life Science
Theme: New
system for measurement, identification and evaluation of regional environmental
noise
October 2002 by Masatsugu Sakurai