| Japanese | English |
The first measurement in 2002 revealed that the prominent frequency was 300 Hz and 24 Hz by the analysis with and without the A-weighting filter. The A-weighting filter was used to compensate the human ear sensitivity. These frequencies corresponds to formant, measured by the first peak in the ACF (autocorrelation function). The ACF has two prominent peaks, one corresponds to formant and another corresponds to pitch (fundamental frequency). The A-weighting filter is effective for the analysis because it emphasizes the formant frequency rather than the fundamental frequency.
This time, the same heart sound is reanalyzed by using DSSF3 ver.5.0.5.6.
postscript, April 2003
This report was written in August 2002. At that time, the running ACF was calculated with the integration time of 2 second, because it is know that human brain process music with a temporal window of about 2 s. We wanted to know how the heartbeat is heard as music. However, it has been found recently that higher temporal resolution is needed to capture the characteristics of heartbeat and lung sound for the medical diagnosis. We are going to progress to the next step of biomedical sound analysis. Heartbeat measurement 1, 2, 3 are replaced by the new experiment in April 2003 and Lung sound measurements are newly added.
In this series of report, the heartbeat measurement is presented as an example of the application of the sound measurement system, DSSF3. Previous results are summarized before introducing new analysis results.
The most important property in the analysis result is a pitch of sound. The value of Tau_1 in the ACF analysis is 41 ms and it corresponds to 24 Hz (1000/41). When a heartbeat is considered as music (it is said that the embryo is hearing it in mother's womb), it is about 24Hz sound.
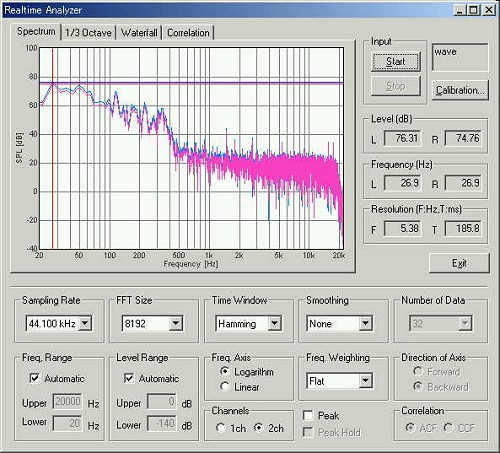
The power spectrum. Frequency weighting is set to flat. In this graph, the fundamental frequency can be found at 26.9 Hz.
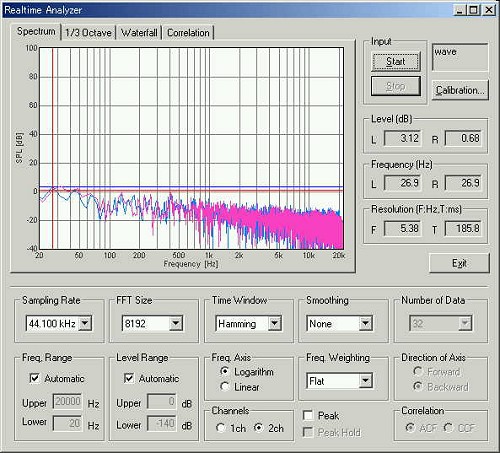
The power spectrum of the background noise. Frequency weighting is flat. Dynamic range of the measurement seems sufficient.
In the following analysis, the heartbeat was caught as music by the time window (i.e. Integration time setting in the Sound Analyzer) of 2 seconds. When the heartbeat rate is from 60 to 120 bpm, one or two heartbeats are included in the analysis for 2 seconds. In the cases of 120-180 bpm, the analysis window contain two or three heartbeats. The ACF was calculated for every 0.1 seconds.
This is a familiar analysis for us to obtain the pitch, the pitch strength, and the reverberation of sound for every 0.1 seconds. Consequently, my heartbeat was the music of a pitch (Tau_1) with a frequency of 24Hz. And the pitch strength (Phi_1) was 0.1 and the reverberation ingredient (Tau_e) was 20 - 40 ms. If 25Hz is the sound of the heart, it can be convinced that it is out of the audible frequency range. If the heartbeat is always audible, it becomes very noisy. In the analysis of heart sound and other biomedical sound, we have to remember that the target sound is an inaudible sound.
For reproducing a heartbeat, headphones are suitable. If an A-weighting (ear compensation) filter is used, a low frequency will be cut and the sound will change to a high pitch. Although most low-pitched sound will be omitted, it is the same as the sound that is heard by our ears.
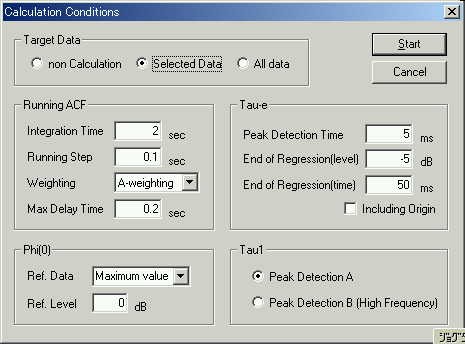
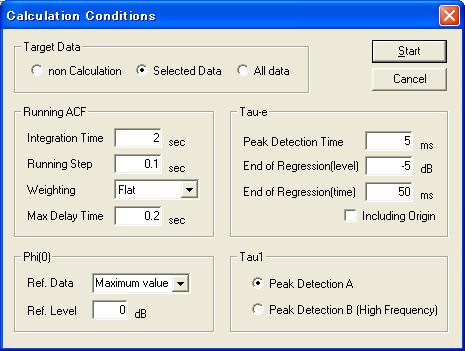
Calculation condition with A-weighting filter is below.
Analysis results
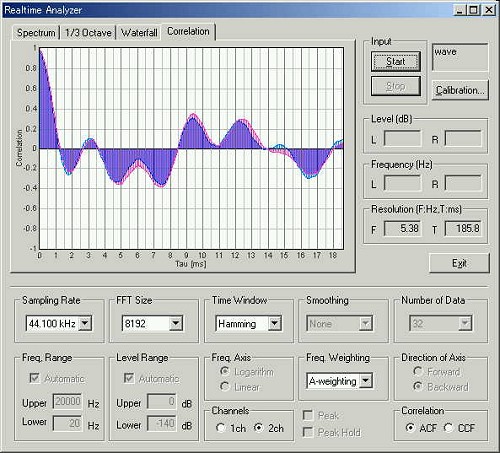
When the heartbeat is analyzed with the A-weighting filter, the pitch becomes 361 Hz (Tau_1 value is 2.77 ms, that is found from 1.3 seconds in the figure above). However, its pitch strength is too weak (Phi_1 = 0.03) . From the ACF waveform (left bottom of the above figure), it turns out that a heartbeat actually has a strong low frequency component (major peak in the ACF is found at 30 ms, that corresponds to 33 Hz). The value of Tau_e is 6 ms. Its reverberation is also small.
The real time display of the ACF.
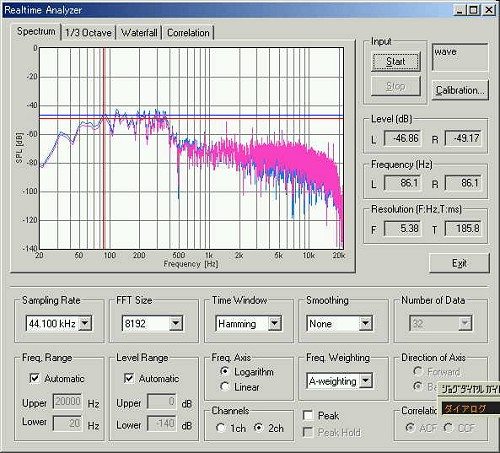
This is the power spectrum display for 2.5 seconds. The dynamic range is decreased. It is because low-pitched sound was cut from the recorded sound. The fundamental frequency can be seen at 86Hz. A small peak at 360 Hz is also seen.
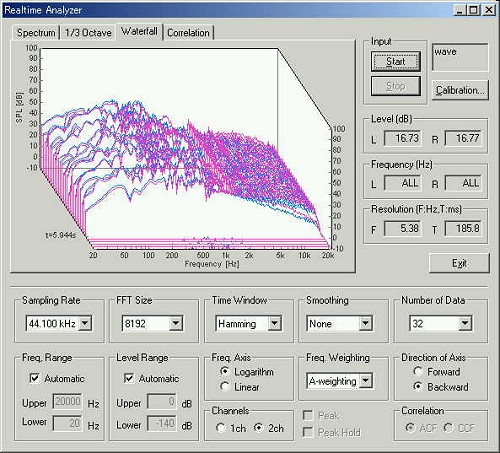
This is the 3D display of the power spectrum
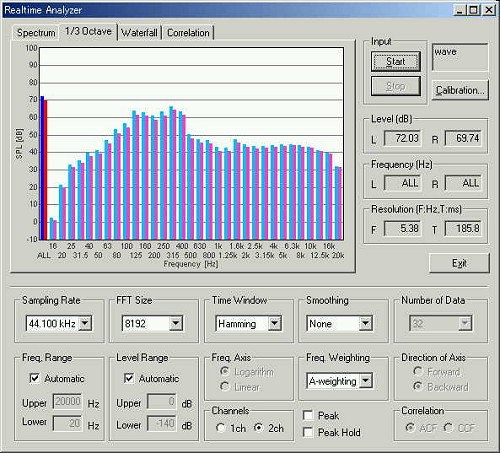
This is the 1/3 octave analysis for the A-weighting filtered heartbeat. The energy above 20 dB from the maximum is distributed between 80 and 400 Hz.
Auscultation of a heartbeat is included in the clinical inspection. The cardiac noise accompanying the unusual heartbeat or heart murmur (noise) is treated as abnormality. Compared with the time of normal, if noise increases, it will be requiring special attention. Although early detection is the most important to find any disease, discovery is difficult for early trifling abnormalities. It is because it is not known whether it is unusual if it is not contrasted with the normal state before. As an everyday health management, measurement of a heartbeat is very effective.
August 2002 by M.Sakurai
From here, written in 2004/07/21
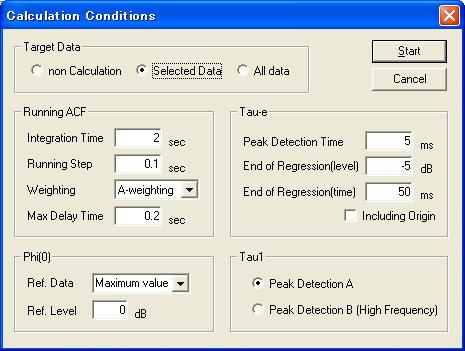
The recorded heart sound as in the previous report heart1.wav is analyzed in SA. Calculation conditions are set as below. Frequency weighting is set to Flat.
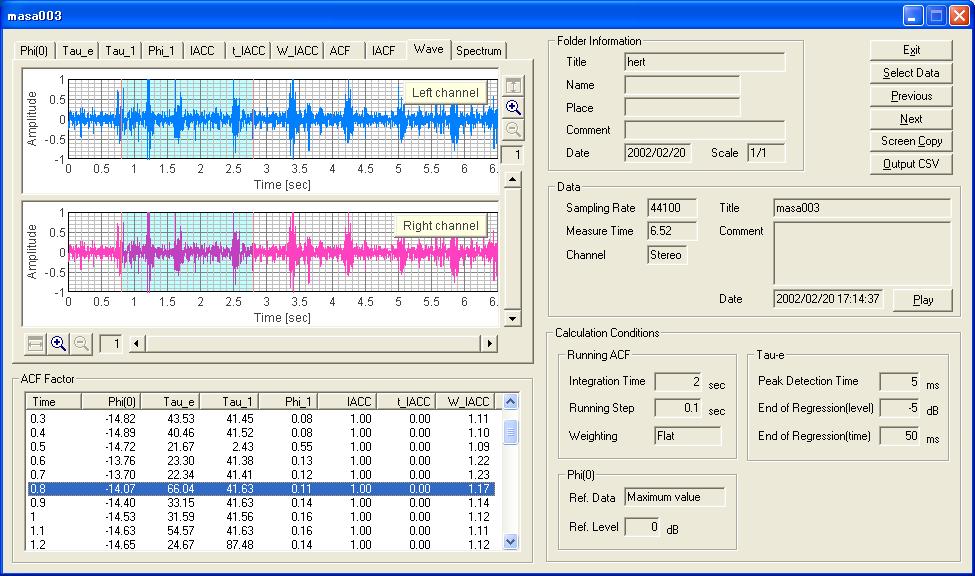
The next figure shows the temporal waveform of the recorded sound. The blue area between 0.8 s and 2.8 s indicates the selected analysis frame in the table below the graphs. Note that the analysis is performed for the data portion of 2.0 s in every 0.1 s. The values of τ1 (Tau_1 in the table) is about 41 ms, correspond to 24 Hz.
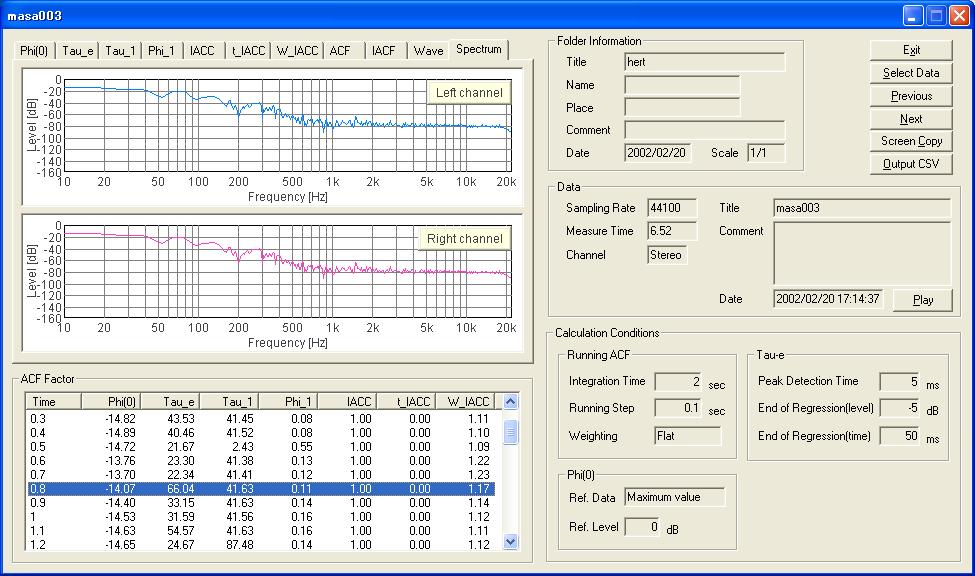
The next figure shows the spectrum of that data portion. I can see most energy is included below 80 Hz. The energy decreases about 10 dB between 100 and 150 Hz, 20 dB between 200 and 300 Hz.
Note that the analysis time length is different from the previous measurement. In the spectrum shown above, the sampling rate was 44100 Hz and the FFT size was 8192, resulting the analysis time of 8192/44100 = 0.185 s. In the spectrum below, the analysis time is 2.0 s.
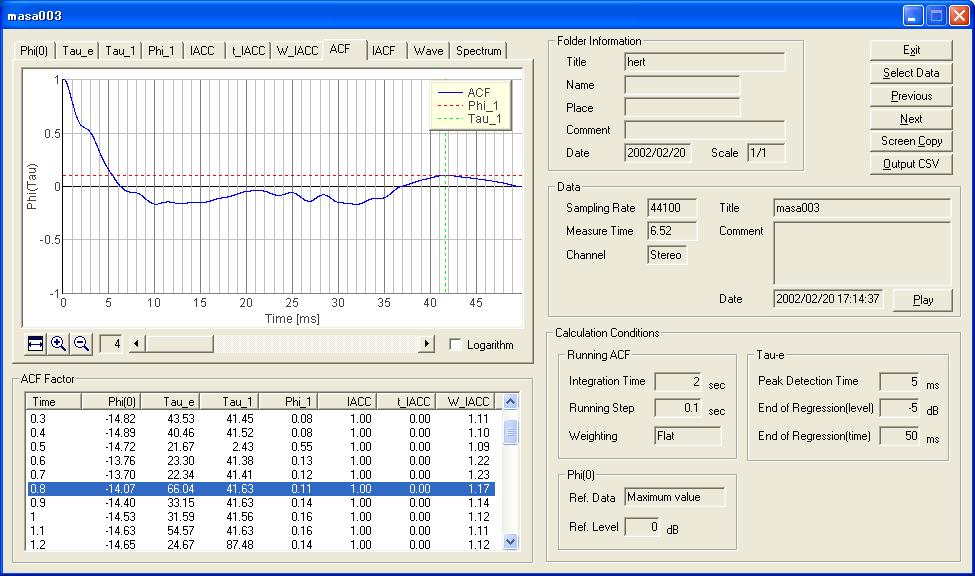
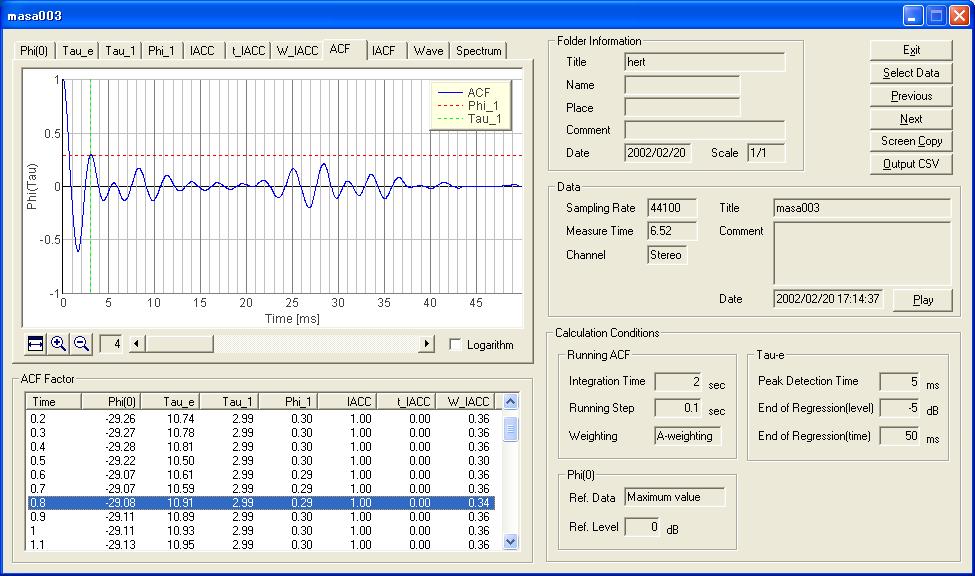
The next figure shows the ACF of the same data portion. The first peak found at 41 ms is indicated by the green dotted line. I can say that the heart sound is dominated by the low frequency component.
For comparison, the next figure shows the ACF of the same data portion calculated by using the A-weighting filter. Because the A-weighting filter reduces the energy at the low frequency, the periodic component in the high frequency region becomes dominant.
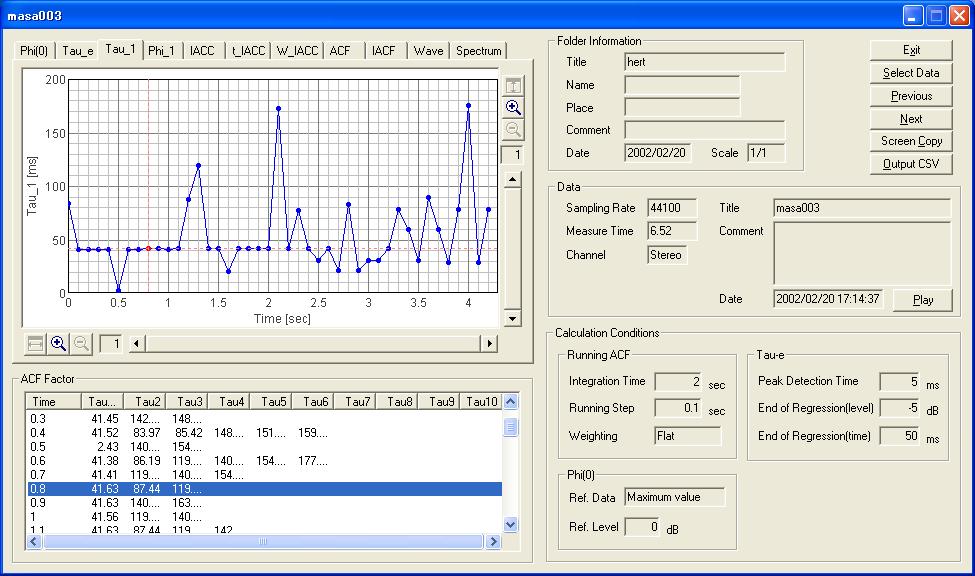
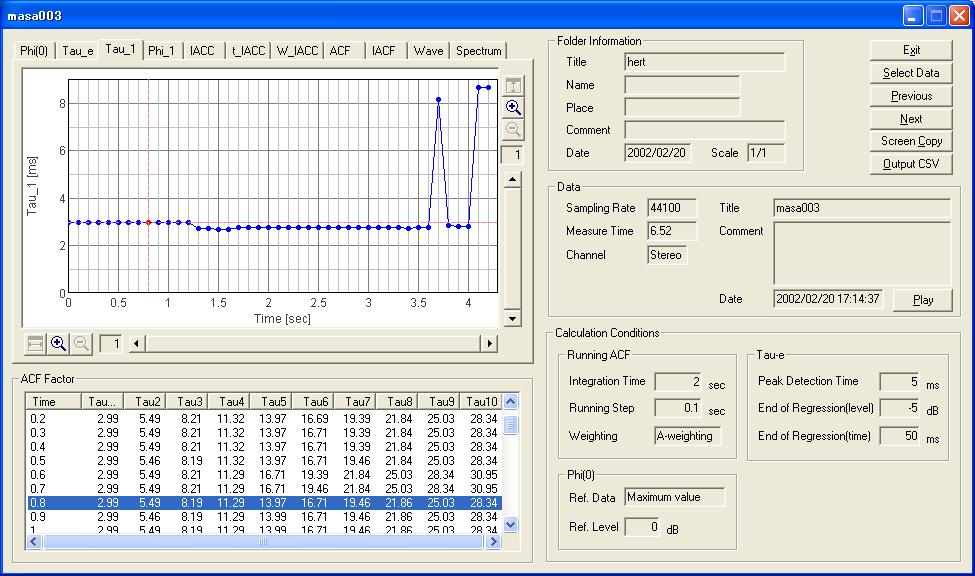
The next two figures show the time course of Tau_1 value. The first graph is the result of Flat analysis, and the second graph is the result of A-filter analysis.
In the case of the Flat analysis, mean value of Tau_1 is about 41 ms, corresponding to 24 Hz.
In the case of the A-filter analysis, mean value of Tau_1 is about 3 ms, corresponding to 330 Hz.
This time, I reported the results of the Flat analysis and the A-filter analysis. The difference of these two analyses is the selection of "Weighting" in the calculation condition.
2004/07/20