| Japanese | English |
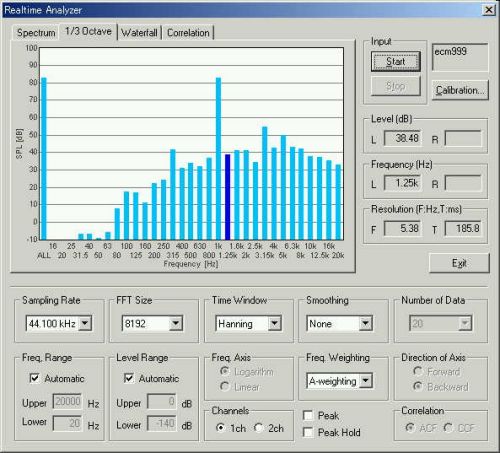
Last time, it was reported that a microphone input was appropriately recorded using DAT as a microphone amplifier. The figure below is the 1/3 octave analysis when outputting 1kHz sine wave (it was measured with the A-weighting filter). The volume of 84dBA was also confirmed by the sound level meter.
The impulse response was measured in the listening room.
sound file:![]() audio2.wav (44.1 kHz / Stereo / 0.372 s / 64 KB)
audio2.wav (44.1 kHz / Stereo / 0.372 s / 64 KB)
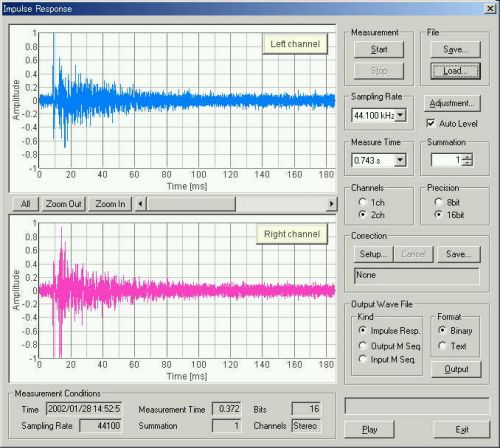
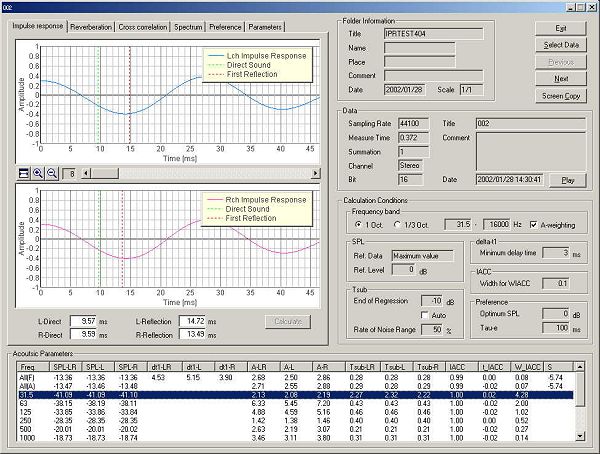
The figure above shows the two channels (left and right) impulse responses measured with the sampling frequency of 44.1 kHz and measuring time of 0.743 s.
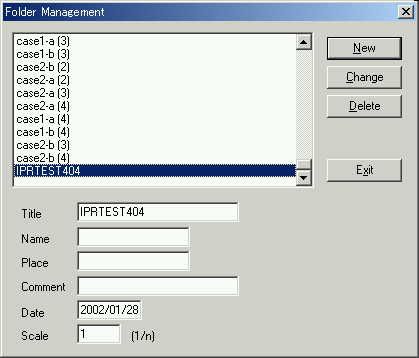
Since the problem of the input level was solved with a microphone amplifier, the impulse response has been measured without any problem. To save data, create a new folder.
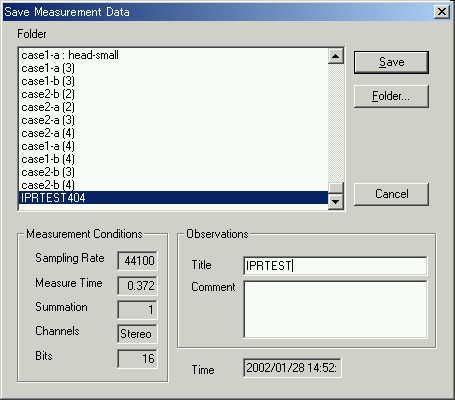
Specify the folder and save the measurement data.
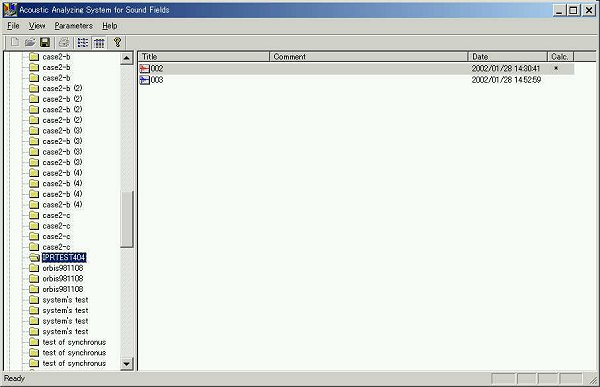
Saved data can be analyzed by Sound Analyzer (SA). Select File > Open to specify the data to be analyzed. The saved data will be displayed in a list view.
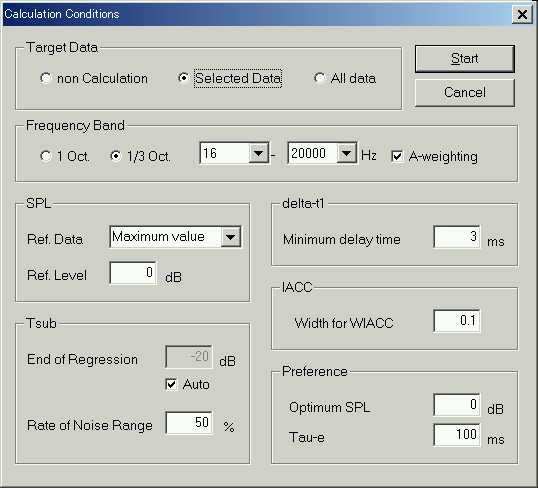
Select Parameter > Calculate to analyze the data. Calculation condition can be configured as below.
Let's see the results. The figure below is the raw impulse response display in the results window.
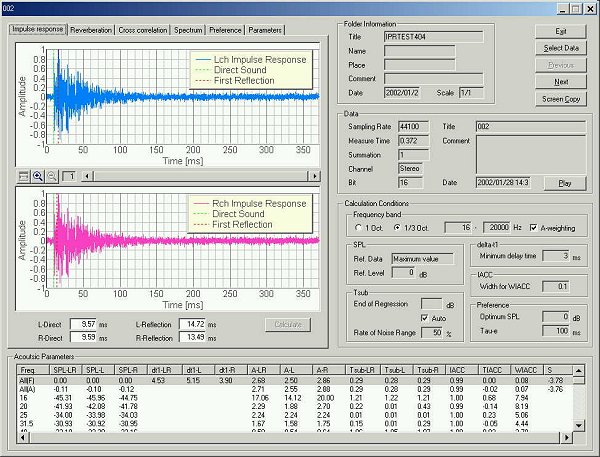
In this graph, check the first reflective sound. In the room acoustics, the first reflection is the most important than other reflections.
The initial time delay gap (dt1) is defined as the time delay of the initial reflection from the side wall after the direct sound. The first maximum amplitude in the impulse response is decided as the initial reflection. Note that the floor reflection (amplitude peak found shorter than 3 ms) should be neglected.
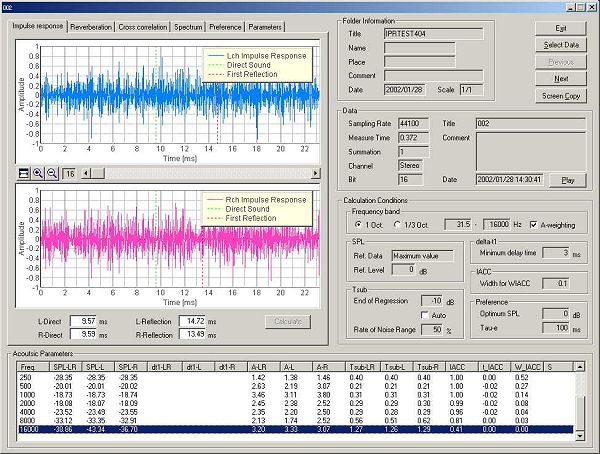
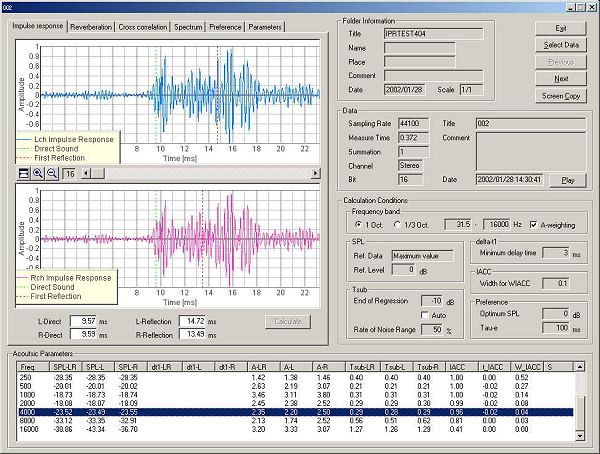
This is the impulse response for all frequency range. The graph for All (A-weighted) is displayed.
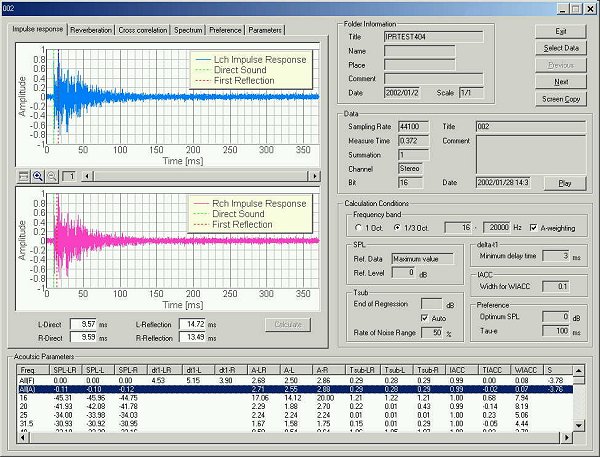
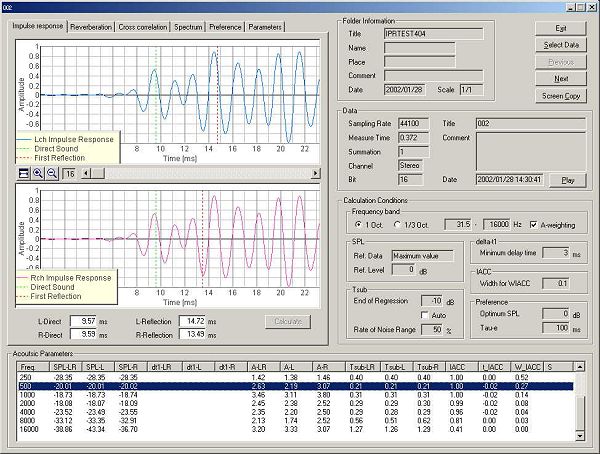
The waveform of the impulse response is zoomed up to x16. The arrival time of the direct sound is 9.57 ms and 9.59 ms for left and right channels. Time difference of two channels' input is 0.02 ms. This is expressed by the acoustic parameter, tIACC, which is calculated from the cross-correlation function. And it is useful for the time alignment adjustment for the listening room. It should be noted that the tIACC value could also be calculated from the running ACF measurement. If you worry that the impulse response measurement may damage your loudspeaker, you can try the running ACF measurement.
Arrival time of the first reflection is indicated in the figure above. That is 14.72 ms and 13.49 ms for left and right channels respectively. It has been found that the time difference between the direct and the first reflection (dDt1) is one of the important parameters for room acoustics quality. These values are indicated in the table below the waveform display.
As shown in below, the S/N ratio is not good for the 31.5 Hz or 16 kHz impulse responses. It might be the limitation of the frequency response of the loudspeaker used (KENWOOD OMNI5).
This is the impulse response for 500 Hz. This frequency band is used for measuring the reverberation time.
This is the impulse response for 4 kHz. Acoustic parameters are usually evaluated for 500-4kHz range.
Distance between the speakers and the microphones is calculated from the arrival time of the direct sound. In this case, that is 325 cm (34000 cm/s * 0.00957 s = 325.38 cm) and 326 cm for left and right channel. Also, the distance of the initial reflected sound is 500 cm and 458 cm for left and right channels.
The automatic measurement logic of the initial reflection makes the analysis of the impulse response easy. SA can make various settings, such as analysis conditions in 1/3 octave analysis, and can repeat calculation any times.
May 2003 by Masatsugu Sakurai