| TOP | STORE | DSSF3 | RAE | RAD | RAL | MMLIB | Support | Contact Us |
![]() About
this manual
About
this manual ![]() Introduction
of SA
Introduction
of SA ![]() Reference
Manual
Reference
Manual ![]() Appendix
Appendix
Impulse response analysis
Running ACF analysis
Impulse response analysis at Ando lab, Kobe University
Acoustical parameters (physical quantities describing the acoustical properties of sound fields) are calculated from the binaural impulse responses, which were measured by using dummy head or microphones attached to the real head. It is considered that all the acoustic information that affects the subjective attribute in the sound field is included in the sound signal (impulse response and music source) reaching at the entrance of both ears. To understand the properties of sound fields, Ando 1) proposed the four orthogonal parameters, that express the features of the impulse responses well and affect the subjective preference independently.
Below, it is described how to calculated these parameters from the impulse responses.
1. LL (Listening Level )
Listening level is measured as the relative sound pressure levels at receiving points to the reference point*. Values are obtained for six octave bands between 125 and 4000 Hz, and for broadband (from the all-pass band impulse response with the A-weighted filter).
In the equation, hl,r shows the left and right channel impulse responses at the receiving point, and href shows the impulse responses at the reference point. For the href , the integration limit should contain the direct sound alone. In most cases, it should be 4 ms from the starting point of the direct sound, because the earliest reflection comes from the stage floor.
* The reference measurement is performed at the distance of 1 m from the sound source, using the monaural microphone.
2. Dt1 (Initial time delay gap between the direct sound and the first reflection [ms])
The first reflection is defined as the earliest and the most significant reflective sound after the direct sound, excluding the reflections from the floor. The time delay between the direct sound and the first reflection [Dt1] is measured in ms. Usually, the first reflection is read directly from the raw impulse response, considering the size of the room. To read it automatically, the reflection with the largest amplitude after the direct sound can be decided as the first reflection, because it has been found that the most preferred Dt1 depends not on the earliest reflection, but on the largest reflection 2).
3. Tsub
Several definitions of the reverberation time (T20, T30, EDT, and so) are standardized, but we define Tsub as the time required for the impulse response to decrease 60 dB from the arrival of the first reflection. Reverberation time is calculated from the Schroeder integration curve3) (backward integration of the squared impulse response). As shown below, the initial part of the Schroeder integration curve is fitted by the straight line, and this line is extended to -60 dB. Tsub is calculated for six bands between 125 and 4000 Hz.
4. IACC (Inter-Aural Cross-Correlation)
For the calculation of IACC, the following two measurements are recommended.
(1) To evaluate the spatial property of the sound field, IACC is measured for six octave bands between 125 and 4000 Hz. As in the equations below, IACC is defined as the maximum value of the cross-correlation function within ±1ms, that is calculated for the time range including the direct and all of the reflective and the reverberation components.

(2) To evaluate the spaciousness and the preference of performance, a piece of music (or speech) is reproduced on the stage, and is recorded at the audience seats. Cross-correlation function is calculated to the binaural signal recorded, and three parameters (IACC, tIACC, and WIACC) are calculated. For practically, this analysis can be performed on the convoluted dry sources (anechoic recordings) with the measured binaural impulse responses.
Additional parameters
The parameters described below are not the orthogonal factors by Ando, but they also affect the subjective preference.
5. A-value (total Amplitude of reflections)
The ratio of the reflection and the direct sound, A-value, is defined as follows.
Here, h(t) expresses the impulse response. The value of e expresses the duration of the direct sound (it is usually 3-5 ms, but in the current version of SA, e=Dt1 is used).
The A-value is strongly related to the clarity and the reverberance of sound. It is known that the reverberation time is almost constant in a concert hall, but the sound quality is quite different from the front seat and the rear seat. It is because the ratio of the direct and the reflective sound is different. For example, at the seat close to the stage, the ratio of the direct sound is high (i.e. A-value becomes small). In this case, very clear sound is heard. The ratio of the reflective sound becomes high as it becomes far from the stage, and the reverberant sound can be heard.
The A-value has a close relationship to the preferred Dt1. When the A-value becomes large (e.g. amplitude of the reflection becomes large), the best Dt1 becomes short. Also, we are sensitive to the difference in Dt1 when the A-value is small. But we are not aware of the difference when the A-value is small, so the range of the best Dt1 becomes large.
WIACC(Witdh of the Inter-aural cross-correlation)
WIACC is related to the Apparent Source Width (ASW). It is defined as the width of the peak in the cross-correlation function. WIACC becomes large when the signal contains lower frequency components.
7. tIACC (inter-aural time difference)
In the figure above, the delay time of the peak is called tIACC. This parameter represents the horizontal direction of the sound source. When the listener (or dummy head in the measurement) faces to the source, IACC=0. The IACC becomes positive when the source is localized to rightward, and negative when the source is localized to leftward, respectively.
References
1) Ando, Y. (1985). Concert hall acoustics, Springer-verlag, New York.
2) Ando, Y., and Gottlob, D. (1979). Effects of early multiple reflections on subjective preference judgments of music sound fields, J. Acoust. Soc. Am., 65, 524-527.
3) Schroeder, M.R. (1965). New Method of Measuring Reverberation Time,J.Acoust. Soc. Am., 37, 409-412.
Calculation of the Speech Transmission Index (STI)
For evaluating the speech intelligibility, STI (Speech Transmission Index) or its simplified version, RASTI (Rapid Speech Transmission Index) are calculated based on the MTF (Modulation Transfer Functio). STI and RASTI have been proposed by Steeneken & Houtgast (1980) and Houtgast & Steeneken (1984). Later, these indices have been standardized in IEC 60268-16. Calculation procedure of these indices is briefly described below.
(1) MTF measurement
Conventionally, MTF has been measured by using a sinusoidally modulated band-pass noise. In the figure below, m(F) expresses the ratio of the modulation depth (amplitude of the sinusoid) between input and output. It is interpreted that the smaller the m becomes, the more the signal is distorted. Significant factors that affect the MTF in the sound field are the background noise and the reverberation.
Later, Schroeder (1981) has shown that the MTF can be measured as a Fourier
transform of the impulse response as shown in the equation below. This method is
widely used now. In the equation, h(t) expresses the impulse response.
The m(F) is calculated to the band-passed impulse responses (for seven bands) for the following calculation.
(2) Calculation of STI
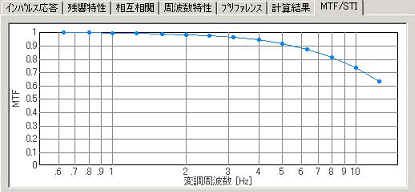
To calculate STI, MTFs of seven octave bands between 125 and 8000 Hz are used. For each octave band, mk,f (k: octave band, f: modulation frequency) is obtained for the modulation frequencies corresponding to the envelope of the speech signal. Those are 14 frequencies between 0.63 and 12.5 Hz divided in a 1/3 octave manner. In SA, MTFs in each octave band are displayed as below.
First, mk,f is transformed to the signal to noise ratio (SNRk,f) as follows.
![]()
Then, SNRk,f is normalized to TIk,f (Transmission Index). In this transformation, SNR between -15 dB and +15 dB is normalized between -1 and +1. SNRs below -15 become -1, and SNRs above +15 become +1.
![]()
Next, TIk,f is averaged within each octave band to calculate MTIk (Modulation Transfer Index).
![]()
Finally, MTIk is summed up with the weighting coefficients to obtain the STI. In the equation, Wk is the weighting coefficient described in Steeneken & Houtgast (1980).
![]()
Additionally, in IEC60268-16, weighting coefficients are used for male and female speech differently to obtain the revised STI (STIr).
(3) Calculation of RASTI
For calculating the RASTI, MTFs in 500 and 2000 Hz are used. Modulation frequencies are 1.0, 2.0, 4.0, and 8.0 for 500 Hz, and 0.7, 1.4, 2.8, 5.6, and 11.2 Hz for 2000 Hz. Following the procedures above, nine TIs are obtained in total. RASTI is obtained by summing up these TIs without weighting coefficients.
![]()
References
1)Steeneken, H.J.M. and Houtgast, T. (1980). A physical method for measuring speech-transmission quality, Journal of the Acoustical Society of America, 67, 318-326.
2)Houtgast, T. and Steeneken, H.J.M. (1984). A multi-language evaluation of the RASTI-Method for estimating speech intelligibility in auditoria, Acustica, 54, 185-199.
3)Schroeder, M.R. (1981). Modulation transfer functions: definition and measurement, Acustica, 49, 179-182.
4)IEC 60268-16 Third edition (2003-05). Sound system equipment- Part 16: Objective rating of speech intelligibility by speech transmission index.
Calculation of the room acoustics parameters (according to the ISO 3382 normative)
In SA (ver.5.0.4.0 or later), the room acoustics parameters are calculated according to the ISO 3382 normative. Results are displayed as functions of the center frequency (1/1 or 1/3 oct) as shown in the figure below.
The acoustics parameters are classified into four groups: 1) sound level (Strength: G), 2) reverberation time, 3) balance between early and late arriving energy (Clarity, Definition, Center time) , and 4) binaural parameters (IACC, Lateral Fraction). All of those parameters are calculated directly from the measured impulse responses.
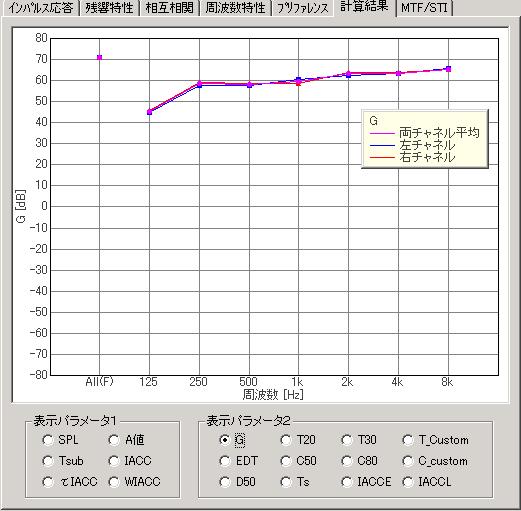
1) Sound level (Strength:G [dB])
The numerator in the above equation is the sound level measured in the hall. The denominator is the sound level measured in the anechoic room at the distance of 10 m (reference level).
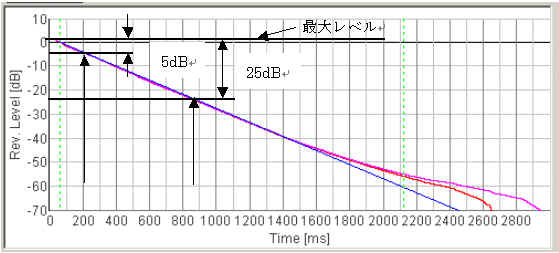
2) Reverberation time (T x[s]、EDT [s])
The reverberation time is defined as the time at which the reverberation curve decays below -60 dB. It is common to fit the initial part of the reverberation curve by the straight line, because the reverberation curve itself is not straight until -60 dB. The next figure shows the example of the Schroeder integration curve and its linear regression. According to the range of regression, the reverberation time is defined as T20 (-5dB~-25dB) or T30 (-5dB~-35dB). In SA, the range of the regression can be set by users to calculate T_custom.
There is another definition of the reverberation time, EDT (Early Decay Time), which in particular weights on the initial part of the reverberation curve. EDT is calculated from the regression line which is fitted to the first 10 dB decay. In Jordan (1981), it is said that the subjective reverberance is much affected by EDT than conventional T20 or T30. Therefore, it is general to evaluate EDT and T separately.
3) Balance between early and late arriving energy (Clarity [dB], Definition [%], Center time [s])
There are several parameters that can be used to express the balance between energies included in early and late parts of the impulse response. The parameters in this group is known to be strongly related to clarity and reverberance of the sound field. One of the commonly used parameter is an early-to-late sound energy ratio. This is calculated for the early time limit of either 50 ms or 80 m depending on whether the measurements are intended to evaluate the conditions for speech or music respectively.
Here, Ct is termed the early-to-late index, and t is the early time limit of either 50 ms or 80 ms. Note that C80 is usually named Clarity. In SA, C50 and C80 is calculated as default. C_custom is also calculated if the early time limit of t is set manually.
It is also possible to measure an "early to total" sound energy ratio. For example, D50 (Definition) is used for evaluating the clarity of speech.
![]()
D50 is exactly related to C50. These can be transformed by the following equation.
Centre time (Ts: [s]) is the center of gravity of the squared impulse response and is calculated by the following equation. Ts becomes large when the impulse response contains much reverberation components, thus low clarity and high reverberance is perceived. Ts is also highly correlated with the reverberation time.
4)) Binaural parameters (IACCEarly, IACCLate)
Originally, the binaural parameter IACC has been calculated for the whole impulse response. But recently, Hidaka (1995) proposed a method of calculating IACC for early and late parts of the impulse response separately. In the following equation, t1 and t2 define the time limit for the impulse response.
IACCE(t1=0、t2=80ms) weights more on the early reflections. It is said that IACCE corresponds well to the Apparent Source Width (ASW). IACCL(t1=80ms、t2=750ms)is calculated for the late part of the impulse response to evaluate the Listener Envelopement (LEV). Hidaka (1995) also suggested to calculate IACC E and L for the center frequencies of 500, 1000, 2000 Hz and average them, to obtain IACCE3 and IACCL3.
Note that some of the parameters mentioned above are highly correlated each other, thus do not affect the subjective evaluation of the sound field independently. Also, note that those parameters were based on the limited experimental conditions.
References
ISO 3382. Acoustics- Measurement of the reverberation time of rooms with reference to other acoustical parameters. International Organization for Standardization, 1997.
Jordan VL. A group of objective acoustical criteria for concert halls. Applied Acoustics, 14, 1981.
Hidaka, T., Beranek, L.L., & Okano, T. Interaural cross-correlation,
lateral fraction, and low- and high-frequency sound levels as measures of
acoustical quality in concert halls, Journal of the Acoustical Society of
America, 98, 988-1007, 1995.
Time window and data size for calculating spectrum and ACF
In SA's Running ACF analysis module, sound is divided into small portions overlapping each other, and analyzed continuously to investigate the time change of the acoustic parameters. Calculation condition of the spectrum and the ACF is set as follows.data size: Integration time (decided in the calculation condition window)
percentage of overlap: Running step (decided in the calculation condition window too)
window function: rectangular
The data size and the overlap size is set as time (in second), so the actual data size in sample is Integration time * sampling rate. The overlap size in percent is (Integration time - Running step) / Integration time. The data portion that is used for the calculation is indicated by the blue area in the waveform display. The figure below shows an example, in which data was calculated with the integration time of 0.5 s and the running step of 0.1 s. The waveforms at 0.1 s and 0.2 s are shown here for illustration.
| Y Store. |
| TOP | STORE | DSSF3 | RAE | RAD | RAL | MMLIB | Support | Contact Us |
If you have questions or comments about this
page,
feel free to contact us by email ymec@ymec.com
or by online
inquiry form.