| Japanese | English |
Now let's reproduce this situation by using RA (real-time analyzer) of DSSF3.
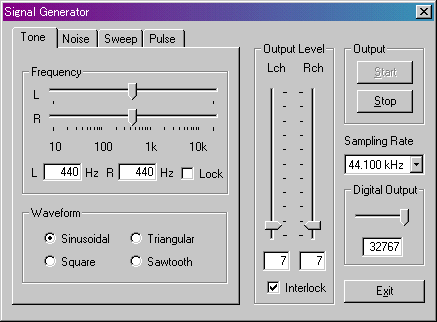
First, start the signal generator and generate sine tones of 440Hz (A4) for both channels. See the signals with an oscilloscope. Check the "X-Y" box on the "oscilloscope" window. In this display mode, signal of the left channel is plotted on the horizontal axis and right channel is on the vertical axis. This plot is called Lissajous pattern. When signals on either channel have the same frequency, you can see the waveform like below.
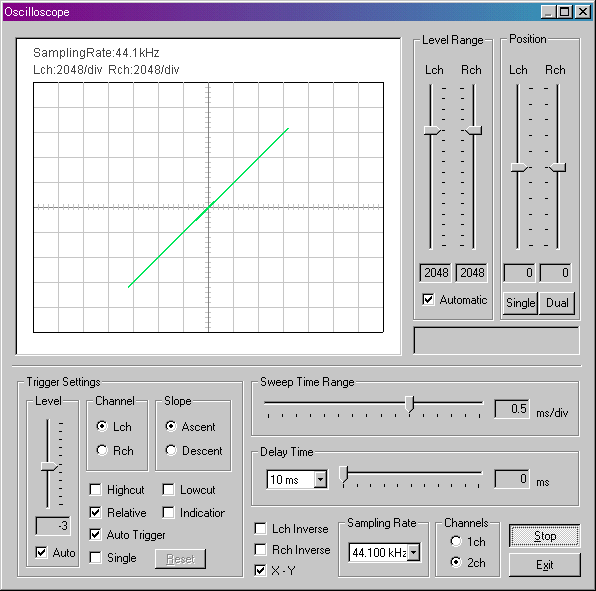
Then, if one channel is 450Hz, what does it become?
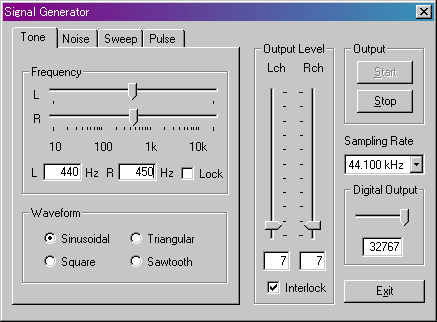
The line of graph moves quickly in a quadrangle. The form of graph is still geometric.
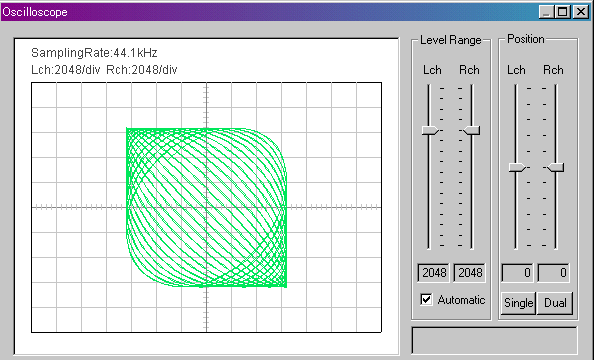
A beautiful figure is made if the frequency of one channel is set to integer multiple of another channel. It can be convinced by eye that harmonic sound becomes beautiful harmony.
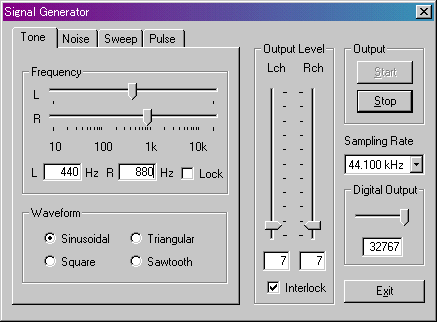
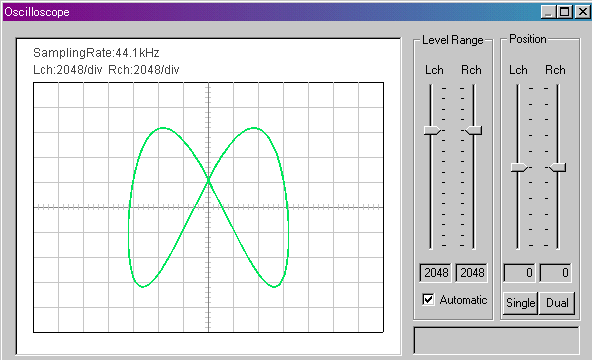
If the graph changes in real time by whether the frequencies are same or not, it may be able to use this for the tuning of guitar.
Same as the previous report, 440Hz sin wave (reference note) is fed into the left channel, and a guitar sound (the fifth string open of) into the right channel with a microphone.
When the guitar sound is low, the line moves quickly in this way.
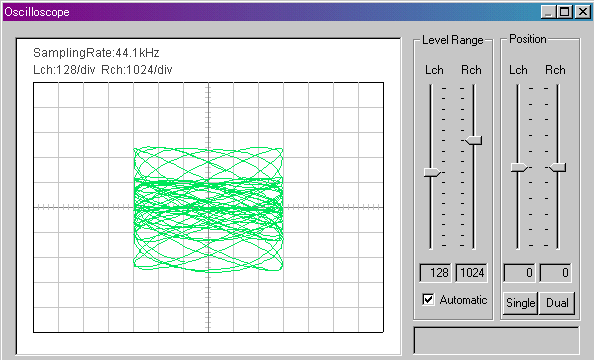
When the guitar sound approaches to the reference note, the line becomes a bunch
like a net, and a motion becomes slow.
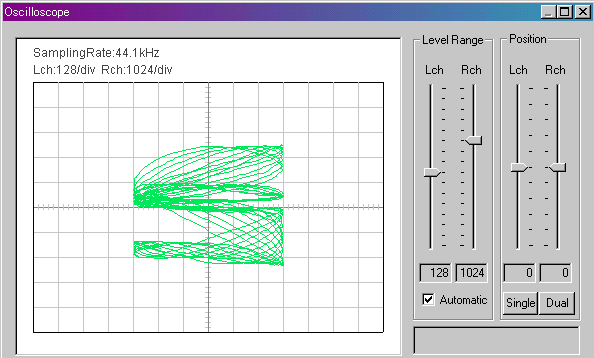
When the guitar's pitch is tuned to the reference note, a thick line is connected like the ring and it rotates slowly. The reason graph does not stop is
not known yet, but is probably because the guitar sound is not stationary.
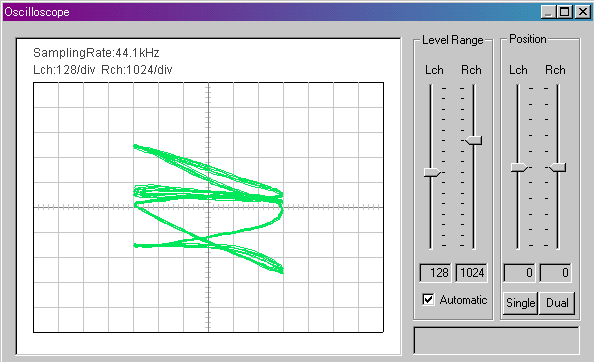
Does the waveform appearing in the X-Y display of the oscilloscope express the timbre of a musical instrument? To investigate this, let's see an electronic piano this time. The 440Hz (A4) sin wave was fed into the left channel, and a piano sound of A into the right channel with the microphone.
A3
It is a sound of A3 (one octave lower than 440 Hz). A twisted ring is rotating.
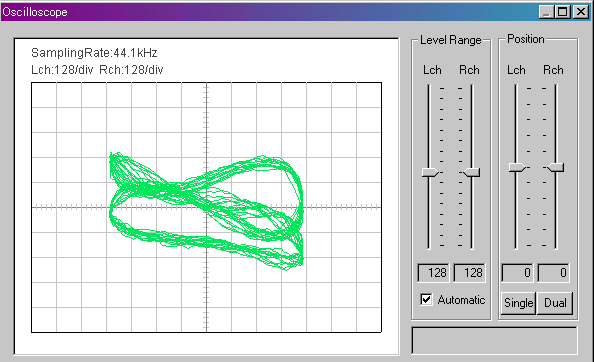
A4
This is 440Hz of a piano. It seems that ring rubber is turning.
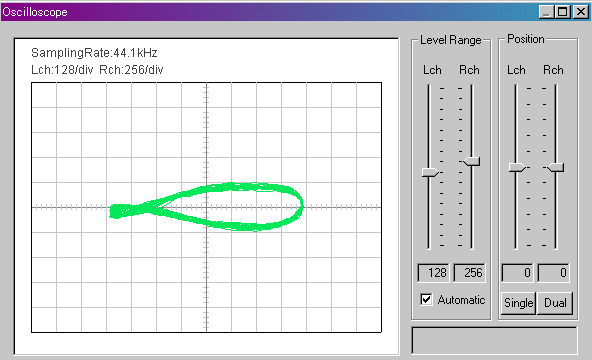
A5
The ring is twisted only once.
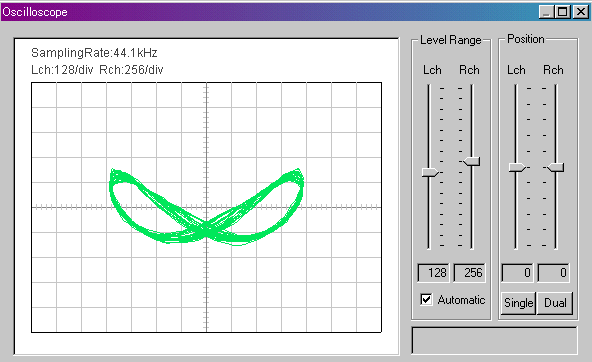
Next, the electronic piano sound is captured not from a microphone but from the headphone terminal. The S/N ratio may be better than the microphone input. The check of the "X-Y" display is released. A red line shows the piano sound.
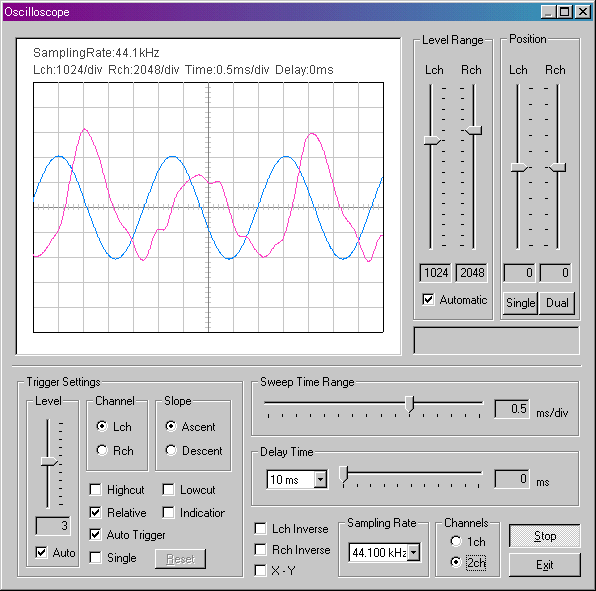
Let's see this signal by the "X-Y" display again.
A3
The bunch of a line becomes thick rather than the microphone input. It
may be because the noise is reduced.
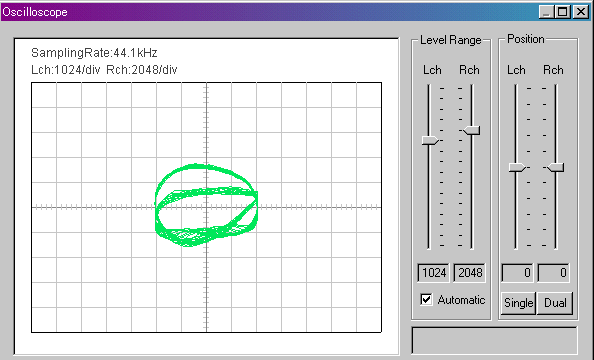
A4
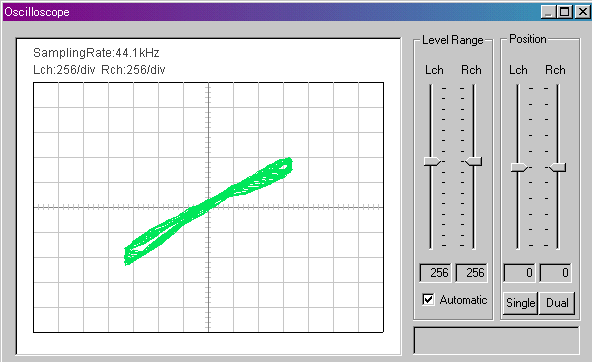
It is very close to the form that synchronizes with the reference sound. If both channels are completely
matched, the graph
becomes the following graph.

The Lissajous pattern appeared in the "X-Y" display of the oscilloscope may not not necessarily reflect the timbre difference of instruments. Remarkable difference could not be seen when the guitar was compared with piano.
November 2002