| TOP | STORE | DSSF3 | RAE | RAD | RAL | MMLIB | Support | Contact Us |
Last updated: 2004/01/21
1. Window configuration
1-1. Main window
This is the window that appears when the program starts up. It consists of
menus, a toolbar, a measurement data list, and a status bar. When a measurement
is made, calculated parameters of the measured data is displayed.
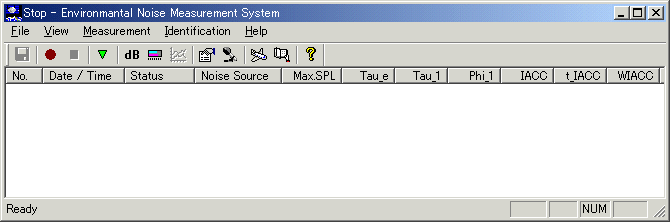
The menu functions are listed below.
File menu
| Item | Explanation |
| Save | This saves the measured data in the database. |
| Exit | This exits the program. |
| Read Wave File...
(DSSF3 ver5 only) |
This menu is added in DSSF3 version 5 (DSSF3
news). Wave file import is now available. Select this menu and specify
the wave file. Measurement is started as same as the recorded sound.
Calculation of the acoustic parameters and identification are possible as for the recorded sound. By this revision, it becomes easy to change the template and try the identification. As the running ACF measurement in RA, calculation can be simplified in the real time measurement (measurement condition can be set to reduce the calculation load). Detailed analysis and identification can be performed later by the batch processing. As a further application, construction of the Internet oriented telemeter noise monitoring system becomes possible. In this system, recording of noise is made in the terminal machine and analysis is made in the host machine. |
View menu
| Item | Explanation |
| Tool Bar | This toggles the toolbar display on and off. |
| Status Bar | Status bar is in the bottom of the main window, in which the message from the system is displayed. Check this menu to change the display of status bar between ON/OFF. |
| Sound Pressure Level | Check this menu to show the SPL window. Trigger SPL for the measurement is also shown in real time. |
| Peak Level | This menu shows the peak level monitor window. In this monitor, the relative SPL of the input signal is displayed. The reference level (0 dB) is the maximum level of the A/D converter. When the input level is higher than -5 dB, the signal waveform might be clipped. In practical, this level depends on the performance of the sound board. For the correct measurement, we recommend to check the performance of your equipment using the oscilloscope and the signal generator. See the program manual of RA (Realtime Analyzer) for this topic. |
| ACF/IACF Factor | This displays the measurement parameter window. (Double-clicking the data that is displayed in the list box will also display this window.) |
| Item | Explanation |
| Start Auto Measurement | Automatic measurement is started with the measurement conditions. Measurement starts when the sound level exceeds the specified trigger SPL. Trigger SPL can be set as the absolute or the relative SPL. When the relative level is selected, the average sound level during the first 2 seconds after the measurement starts is set to 0 dB. The relative sound level is calculated based on this level. |
| Stop Auto Measurement | This stops the automatic measurement. |
| Manual Measurement | Click this menu to open the "Manual Measurement" dialog. In the dialog, input the measurement time and click the "Start" button to start recording. Elapsed time is displayed during the measurement. |
| Measurement Condition | This menu opens the Configuration dialog for measurement conditions. Those conditions are used for the automatic measurement. |
| Input Device Settings | This menu opens configuration dialog of input device. In this dialog, selection of the input device and calibration of the microphone can be done. |
| Recalculation | Click this menu to open the configuration dialog for measurement conditions for recalculating the measured data. Input the conditions and start recalculation. |
| Clear Measured Data | This menu deletes the measured data in the main window of EA. |
| Automatic Calculation
(DSSF3 ver5 only) |
This menu is added in DSSF3 version 5 (DSSF3 news). If this menu is checked, the recorded sound is automatically calculated as before. If the check of this menu is released, sound is only recorded. Using this function with "Auto measurement", the target sound can be recorded easily, according to the specified measurement condition. |
Identification menu
| Item | Explanation |
| Noise Source Template | This menu opens the dialog for setting the noise source template. Those templates are used for identifying the noise source of the measured noise. |
| Change Noise Source | When the noise source identified by the system is not correct, it is corrected here. The training of the identification function is accomplished in this way. |
| Manual Learning | This is the regular measurement mode. This can execute manual learning of the measured data. |
| Auto Learning | Check this menu to change between the manual and auto learning. Auto learning is a function developed for the specific research purpose. Use manual learning for the measurement usually. |
| Item | Explanation |
| About NMS | This displays the program version information. |
| Online Update | This menu updates the program to the latest version through the Internet. To keep your program up to date, execute this function sometimes. |
1-2. Sound Pressure Level window
Select a menu bar from View > Sound Pressure Level to open this window. In
this window, the sound level is displayed in real time during the measurement.
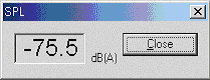
| Item | Explanation |
| Close button | Close this window. |
1-3. Peak level monitor window
Select a menu bar from View > Peak Level to open this window. The peak level
of the A/D converted signal is displayed. The reference level (0 dB) is the
maximum level of the A/D converter.
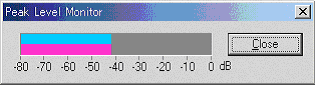
| Item | Explanation |
| Close button | Clicking on this button closes this window. |
1-4. Noise measurement factor window
This window displays the calculated parameters in a graph form.
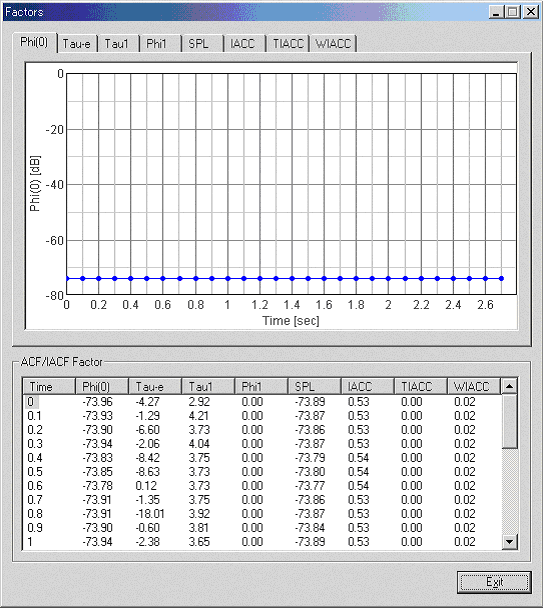
| Item | Explanation |
| Exit button | Clicking on this button closes this window. |
1-5. Configuration dialog for measurement
condition
This dialog window is used to set the measurement and calculation conditions.
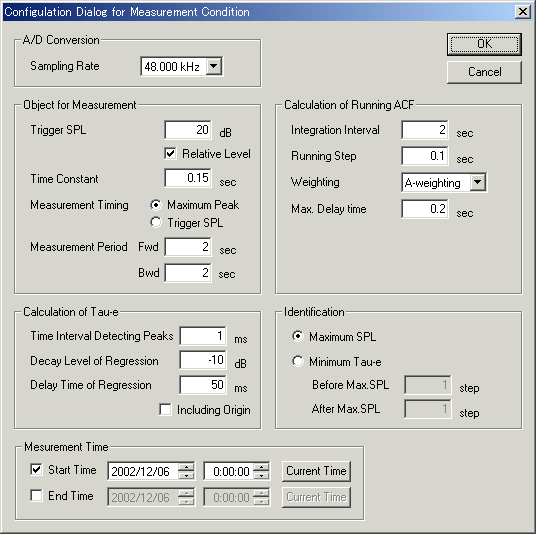
A/D Conversion
| Item | Explanation |
| Sampling Rate | This item sets the number of samples per second. For accurate measurement, select as high rate as possible. We recommend 44.1 kHz or 48 kHz. |
Object for Measurement
| Item | Explanation |
| Trigger SPL | If the sound pressure level exceeds the value set here, automatic measurement (data recording) starts. |
| Time Constant | This item sets the time resolution for measuring the sound level. Default value is 150 ms. |
| Measurement Timing | Timing of the measurement (recording) start is chosen from the trigger
sound pressure level or the maximum sound pressure level. More technically
the recording is done for the specified number of seconds before and after
this basing point. Maximum Peak: Specify the number of seconds before and after the peak. Trigger SPL: Specify the number of seconds before and after the trigger SPL. |
| Measurement Period | This sets the duration for data measurement (recording). Fwd: Specify the number of seconds before the basing point. Bwd: Specify the number of seconds after the basing point. |
Calculation of Running ACF
| Item | Explanation |
| Integration Interval | This item sets the integration time for calculating the ACF and the IACF. The longer this value is, the more time it takes for calculation. Optimal integration time depends on the purpose of the measurement. We recommend this value between 0.001 and 5.0 s. |
| Running Step | It sets the caclucation interval. The minimul interval is 0.005 s. |
| Weighting | It sets the frequency characteristics of the measurement system. Flat (no weighting), A- (mimics the sensitivity of human ear), B-, and C- weighting filters can be chosen. |
| Max. Delay time | It sets the maximum delay time (t) for the ACF. For analyzing the te values correctly, this value must be set sufficiently longer than the expected te values. But if it is set too long, it takes a long time for the calculation. We choose 0.2 s in practice. |
Calculation of Tau-e
| Item | Explanation |
| Time Interval Detecting Peaks | One of the acoustical parameters, te (effective duration of the ACF) is defined as the ten-percentile time delay of the ACF. For calculating the te, the log-transformed ACF is fitted by the straight line for extrapolating the time delay at -10 dB. In this process, the regression line is decided by first several peaks of the ACF. The value set here decides the interval in which the peaks are detected. |
| Decay Level of Regression | Above mentioned peak detection process is ended when the peak value falls below the value set here. Practically, -10 dB is used. |
| Delay Time of Regression | If the ACF does not decreases below -10 dB, the process of peak detection never ends. To finish the process, another condition is set. Peak detection process is ended when the delay time exceeds the value set here. Practically, 50 ms is used. |
Identification
| Item | Explanation |
| Maximum SPL | When this item is selected, identification is done by using the parameters measured at the time that the sound level is the maximum. For the moving sound sources, it means that the sound source is the closest to the microphone. It can be useful for the sound source with a large sound level. |
| Minimum Tau-e | When this item is selected, identification is done by using the
parameters measured at the time that the sound level is the maximum and
that the te value is the smallest. It has been found that the te value
becomes the smallest when the change of the sound quality is the maximum.
By using this timing for identification, the sound can be compared in the
same condition. When this item is selected, the time range before and after the maximum SPL must be specified. These time range is specified by the Running step (calculation interval) of the ACF. |
Measurement Time
| Item | Explanation |
| Start Time | If the check box is checked, the measurement start time can be set. |
| End Time | If the check box is checked, the measurement end time can be set. |
| Current Time button | Clicking on this button obtains the current time. |
1-6. Input device setting dialog
In this dialog, selection of the input device
and the caliburation of the microphone can be done. In the "Configuration
of Input Device" window, input device can be selected. Clicking the
"Edit" button enlarges the window for editing the sensitivity of
the microphone. Calibration data can be saved and selected from this window
before and during the measurement.
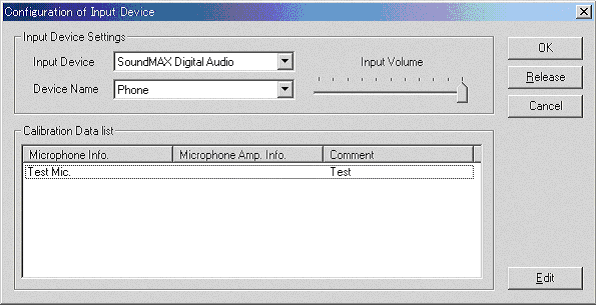
Input Device Settings
| Item | Explanation |
| Input Device | The input device is selected here. |
| Device Name | The type of device is selected here. |
| Input Volume | This sets the volume of the input device. Adjust the volume so that the peak level is -5 dB or less, even at maximum volume. |
| Item | Explanation |
| Microphone Info. | Information concerning the microphone is displayed. |
| Microphone Amp. Info. | Information concerning the microphone amplifier is displayed. |
| Comment | Information about the registered microphones is displayed. |
| Item | Explanation |
| OK | This button makes the selected calibration data effective. |
| Release | This button releases the selected microphone data. In this state, no device is selected. Select a device again. |
| Cancel | This button closes the dialog without any action. |
| Edit | Enlarge the dialog for editing the microphone data. Frequency response and sensitivity are edited. |
1-7. Input device setting dialog (EDIT)
This window allows calibration of the microphone.
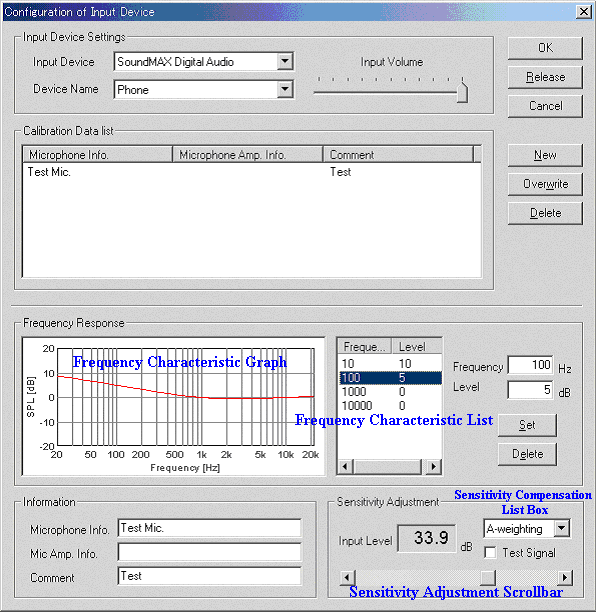
Frequency Response
| Item | Explanation |
| Frequency Characteristic Graph | This graph shows the frequency response of the whole measurement system. Input the frequency and level so that this graph becomes similar to the spec of the microphone. |
| Frequency Characteristic List | List of the frequency response. Input the frequency and its level to edit the frequency response curve. |
| Frequency | To make a response curve, input representative frequencies. The graph reflects your input and is interpolated by the smooth curve. |
| Level | Input a signal level at each frequency. Plus and minus values are accepted. |
| Set button | Click this button to set the input values. The graph is changed by the input values. |
| Delete button | Click this button to delete the data selected in the frequency characteristic list. |
| Item | Explanation |
| Microphone Info. | Information concerning the microphone is entered here (manufacturer, type, etc.). |
| Microphone Amp. Info. | Information concerning the microphone amplifier is entered here (optional). |
| Comment | Comments are entered here. (optional) |
| Item | Explanation |
| Input Level | The current input level is displayed here. To calibrate the input level of the system, compare this level with that of the calibrated sound level meter and move the scrollbar below. To avoid the overload, the maximum noise level supposed should be used for this calibration. |
| Sensitivity Compensation List Box |
Select the frequency weighting of the sound level meter.
|
| Test Signal |
As a test signal, 1 kHz tone is generated. Calibration with this signal
is also possible.
|
| Sensitivity Adjustment Scrollbar |
Use this scrollbar to adjust the input level of the system.
|
| Item | Explanation |
| New |
Click this button to save a created microphone calibration data.
|
| Overwrite |
Click this button to overwrite the selected data by the edited data.
|
| Delete |
Click this button to delete the data selected from the list.
|
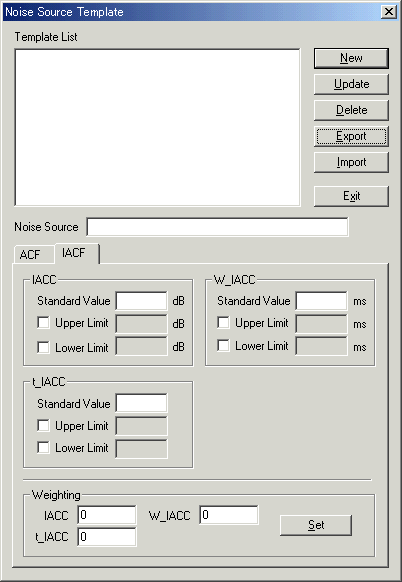
1-8. Noise source template setting dialog
This dialog window allows editing of the noise source templates that are used
for noise source identification.
Identification algorithm: During the measurement, the system calculates the
acoustical parameters from the running ACF and the IACF. Identification is done
by the template matching using those parameters. First, the measured values are
filtered by the specified upper and lower limits of the parameters. If the
parameters are within specified range, distance between the measured and
template values are calculated for each parameter. Finally, each distance is
summed up with the specified weighting coefficients to calculate the total
distance between the measured noise and stored noise sources. The closest
template is decided as a noise source of the measured noise. If no template is
matched, the measured noise is recorded as "Unknown". Attention: For
usual measurement, do not use Auto learning. This function is developed for
specific research purposes.
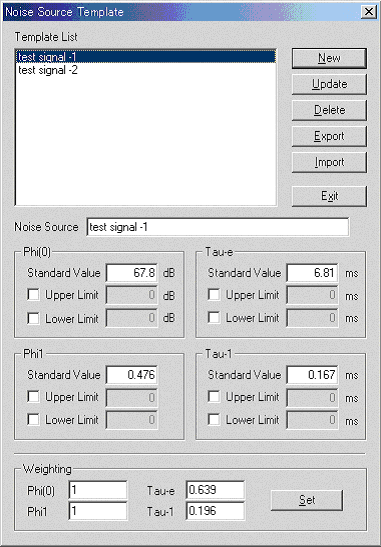
In the Noise source Template, enter the parameter values measured by
the ACF. Parameters with large variance should not be used for the
identification. Do not enter those values or make their weighting zero. If the
parameters for some noise have typical range, input their upper and lower limit.
The system ignores the noise when the parameters are out of those ranges.
| Item | Explanation |
| Template List | This displays a list of the registered noise source templates. |
| Noise Source | This is for entering the name of the noise source. |
| Phi(0) | Enter the mean Φ(0) value of the target noise source. Upper and lower limit values can also be entered. To make those values effective, mark the check box. Data that exceeds the specified range does not affect the template and is not identified. |
| Tau-e | The te, value is set in the same way as described above. |
| Phi1 | The f1 value is set in the same way as described above. |
| Tau1 | The t1 value is set in the same way as described above. |
| Weighting | A weighting coefficient is set for each factor that is used in noise identification. The larger the value of the coefficient is, the greater is the contribution of that factor in the identification. |
| Item | Explanation |
| New | This is for creating a new noise source template. |
| Update | This updates the selected noise source template. |
| Delete | This deletes the selected noise source template. |
| Export | This exports the noise source template. (See the next section.) |
| Import | This imports the noise source template. (See the next section.) |
| Exit | This closes the dialog window. |
1-9. Exporting a noise source template
When the Export button on the noise source template setting dialog window
is clicked, the following dialog window is presented.
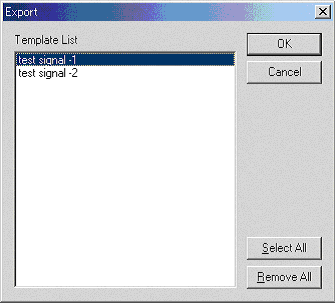
The currently registered noise source templates are listed in the window. Select
the template that is to be exported and then click on the OK button.
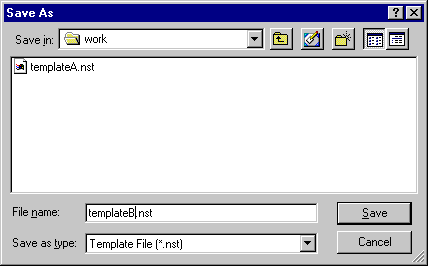
When that is done, a file save dialog window is presented; save the file that is
to be exported. (The file extension is *.nst.)
Importing a noise source template
When the Import button on the noise source template setting dialog is
clicked, the file selection dialog window is presented.
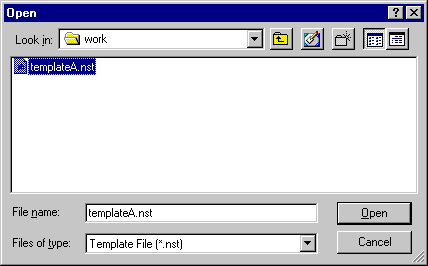
Select a template (i.e., a file with the .nst extension) to bring up the
following dialog window.
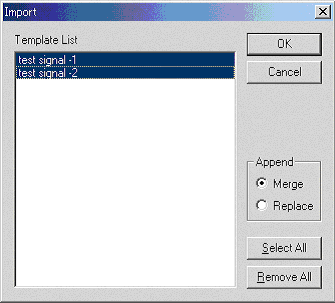
The window presents a list of the noise source templates. Select the noise
source template to be imported from that list (*) and then click on the OK
button. (* Initially, all of the items in the list are selected.)
Now, in the add mode, select either "Merge" or "Overwrite".
If "Merge" is selected and an existing noise source template is
imported, the existing template and the imported template are summed
(synthesized). For example, if there is an existing template named
"plane" for which five rounds of training have been completed and that
template is to be merged with another template that is also named
"plane" for which three rounds of training have been completed, it is
set as a template that has had eight rounds of training.
When "Replace" is selected, the existing template is destroyed and
replaced by the imported template.
If there are no templates that have the same name, any of the templates can be
simply added.
1-9. The noise source correction dialog
When the noise source identified by the system is not the correct source, this
window is used to correct the identification. It is in this way that the
identification function is trained.
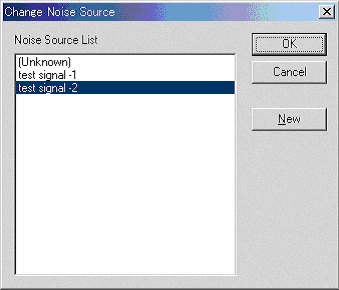
| Item | Explanation |
| Noise Source List | This displays a list of noise source templates. Initially, the currently identified noise source is selected. |
| Item | Explanation |
| OK | Select the correct noise source from the Noise Source List and then click on the OK button to make the correction. |
| Cancel | Clicking on this button closes this dialog window without any action being taken. |
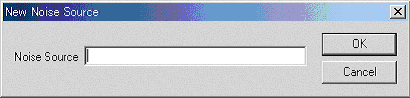
| New | If the noise source is not in the noise source list, click on this button. The "New Noise Source" dialog will be displayed, where you add a new source. |
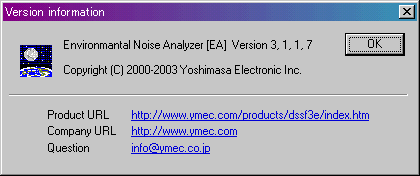
1-10. Version information dialog
This window displays information about this software.
2. Microphone calibration
For the measurement of the noise level (dBA), a microphone should be calibrated.
If you already have done a calibration in RA, you can use that data. To use the
previous calibration data, just select the microphone data in the calibration
window.
For calibrating a microphone, you need a sound
level meter or a microphone calibrator. We recommend to use a sound level
meter with A-weighting mode. After calibrating your microphone with A-weighting,
Flat or C-weighting response can be selected in the program.
Calibration procedure is as follows.
| (1) | Open the peak level monitor window. |
| (2) | Open the Iinput Device Settings dialog. |
| (3) | Click the Edit button to open the edit window. |
| (4) | Select the Input Device and the Device Name. |
| (5) | Input an expected peak level and adjust the input volume so that the peak level is between -15 and -10 dB. |
| (6) | When the frequency characteristic of a microphone is known, input frequency and its level so that the frequency characteristic curve becomes the same. |
| (7) | Put a noise meter and a microphone on the same distance from a sound source. Put a noise meter and a microphone on the same distance from a sound source. Adjust a sensitivity scroll bar so that an input level becomes the same as the display of a noise meter. |
| (8) | Name a microphone and save a data. Choose the saved microphone when you use it. The calibration data is set immediately. |
3. Leaning function
The template for the identification of the noise source can be created by
measuring an actual noise and make it learn to improve its performance. A
learning function can be chosen from manual learning and auto learning.
3-1. Manual learning
| (1) | When the "auto learning" is turned on (when the "auto learning" is checked in the identification menu), turn it OFF. This state is preserved after the program is restarted. |
| (2) | Start the measurement. The acoustic parameter is calculated and the noise source is identified automatically |
| (3) | When the noise source name is not correct, click "Change Noise Source" in the Identification menu. (Right click of a mouse also shows this menu.) |
| (4) | Corrected noise source is marked with "*". Correction can be repeated any times. |
| (1) | Turn "auto learning" ON in the identification menu. |
| (2) | Start the measurement. The acoustic parameter is calculated and the noise source is identified automatically. |
| (3) | If the noise source name is not correct, click "Change Noise Source" in the Identification menu. (Right click of a mouse also shows this menu.) |
| Yoshimasa Electronic Inc. |
| TOP | STORE | DSSF3 | RAE | RAD | RAL | MMLIB | Support | Contact Us |
If you have questions or comments about this
page,
feel free to contact us by email ymec@ymec.com
or by online
inquiry form.