| Japanese | English |
revised on 2004/07/23
In this revision, I rewrote the analysis report as continuation of heartbeat measurement 5, using the latest version of DSSF3.
When I performed heartbeat measurement 1 in 2002, I was going to develop the diagnostic system for hart disease. In 2003, I considered the system which supports a medical checkup and auscultation. Since then, I learned that the cerebral infarction is caused by the heart disease, especially the heart failure. Blood will congeal, if its flow becomes irregular. If it occurred, the flow of blood in an artery supplying the brain is interrupted for longer than a few seconds, then the brain cells may die, causing permanent damage. I found out that it is important to supervise the motion of the heart which manages the blood flow to the brain in order to control so that an irregular pulse does not occur.
Auscultation of a breast is very common. The organs which make sound are lungs and the heart. Other disease may be diagnosed. The sound of lungs and the heart is very complicated. So the qualities of diagnosis are very different between an experienced doctor and an inexperienced doctor.
The relation between heart disease and heart sound is summarized here. This is the continuation from Lung sound measurement 4.
6. Cardiac insufficiency
This is in the state where the function of the heart is weakened and the flow of
the blood of the whole body is overdue. Blood accumulates in lungs and the skin.
It can be diagnosed by the medical examination of whole body including
auscultation.
7. Vavlular heart disease
The heart has the function which continues sending blood to the one direction.
The structure for adverse current prevention called a valve is in each part of
heart so that blood may always flow in the fixed direction. If this valve breaks
or it becomes hard, it will become that blood cannot flow or flow backwards,
finally it will become heart failure. There are four valves in the heart. It can
be diagnosed by auscultation which one is abnormal, whether it is broken or
harden.
8. Congenital cardiopathy
Many of congenital cardiopathy has a characteristic heartbeat. It can be
diagnosed by auscultation.
9. Arrhythmia
The stroke of a pulse becomes less regular. In many case you may leave it.
However, there is a dangerous arrhythmia which causes sudden death.
10. Pericarditis
A pericardium is a film like the bag covering the circumference of the heart. If
inflammation happens here, a motion of the heart may become bad and may cause
heart failure. It is said that pericarditis can be diagnosed by
auscultation.
From here, written on 2004/07/23
Here, I report the spectrum analysis of the first and the second heart sounds, whose duration was measured in the previous report (heartbeat measurement 5).
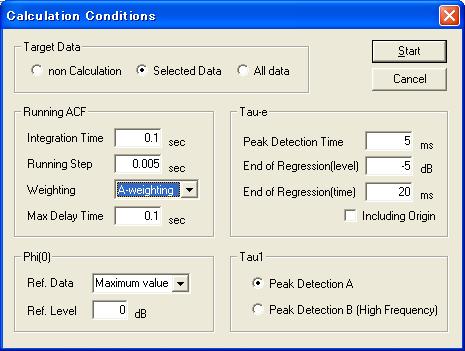
The figure below shows the calculation conditions in the present analysis. The integration time is set to 0.1 s to analyze the first and the second heart sounds whose duration was found to be about 0.18 s. Also, the A-weighting filter is used to analyze the tonal quality of heart sounds as is heard by human.
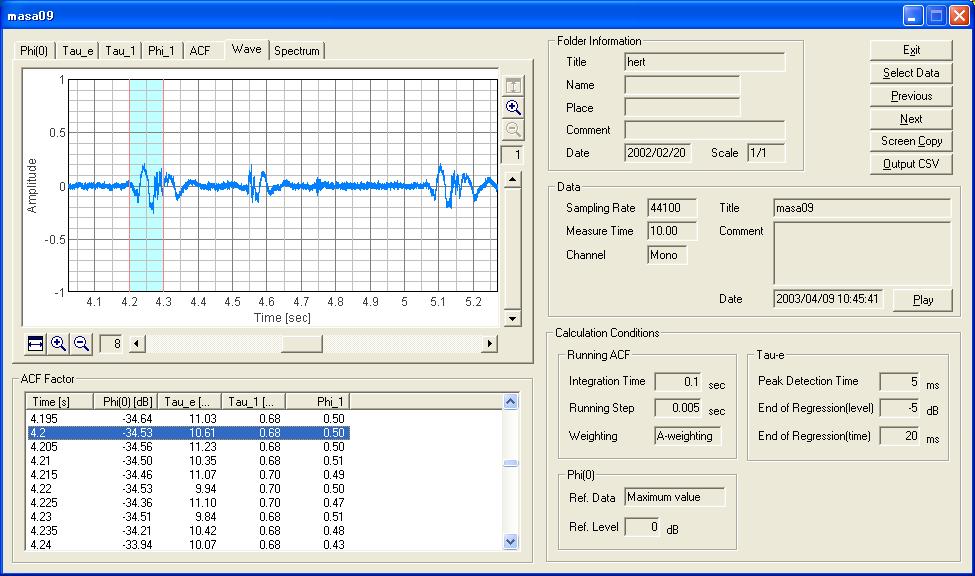
The next figure shows the temporal waveform of the heart sound. The data portion between 4.2 and 4.3 s is selected. This is the beginning of the first sound.
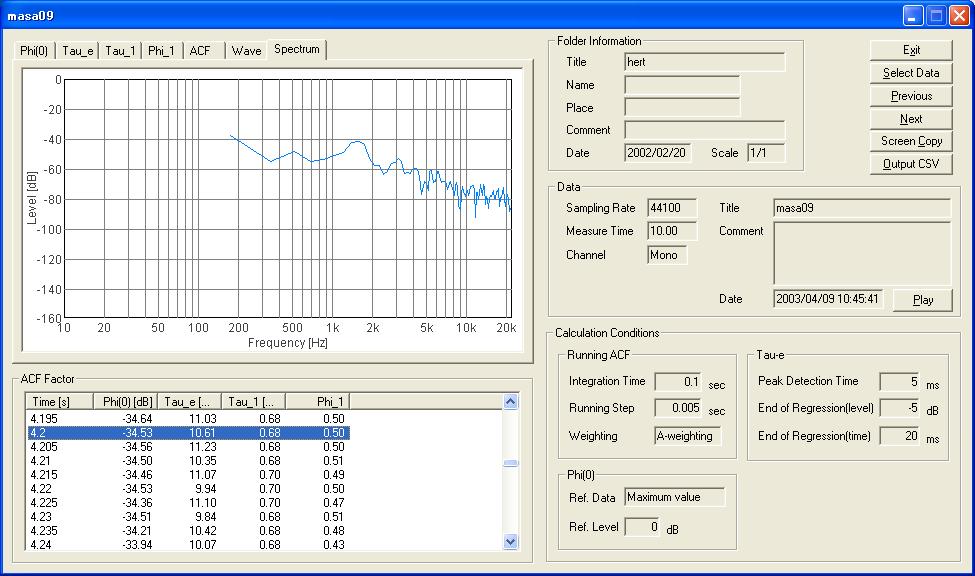
The next figure shows the spectrum of the data portion selected above (4.2-4.3 s). I can see the prominent component at 1470 Hz. Higher harmonics are found at 3 kHz, and at 6 kHz. Subharmonic is also found at 5.5 kHz.
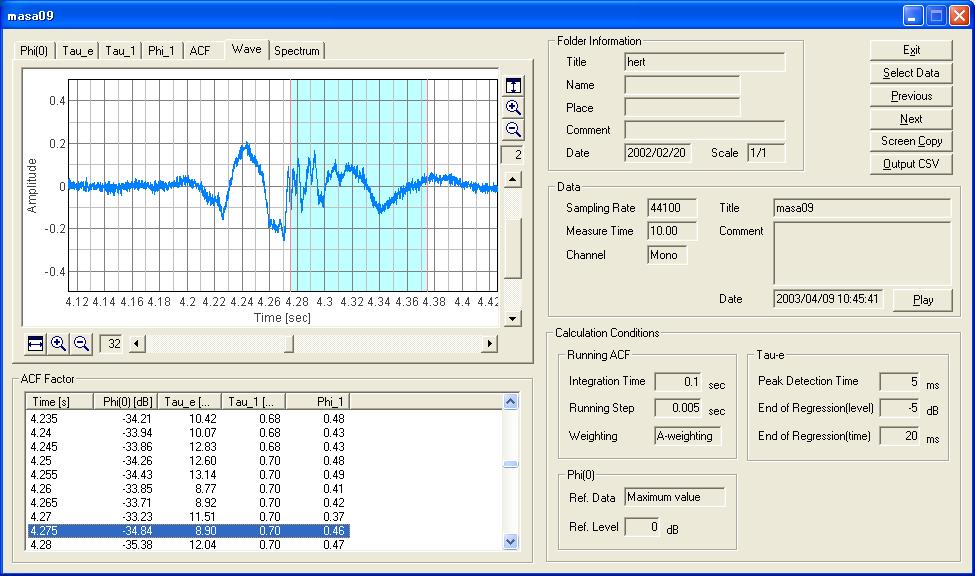
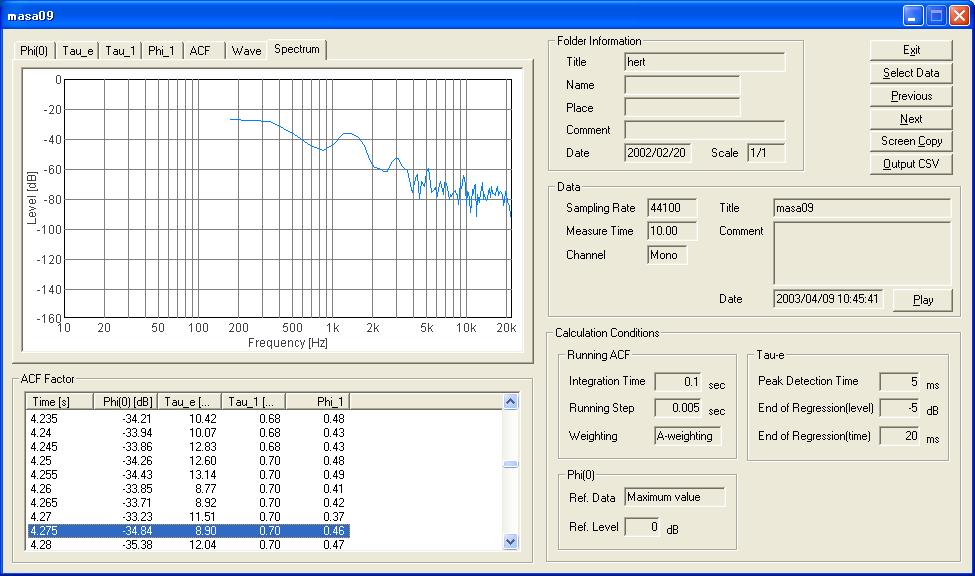
The time axis of the waveform display is zoomed x32. The selected data portion between 4.275 and 4.375 s is a second half of the first heart sound.
The next figure is the spectrum of the data portion selected above. The prominent component is found at 1428 Hz. Harmonics are found at 3 kHz, 5 kHz, and 9.5 kHz.
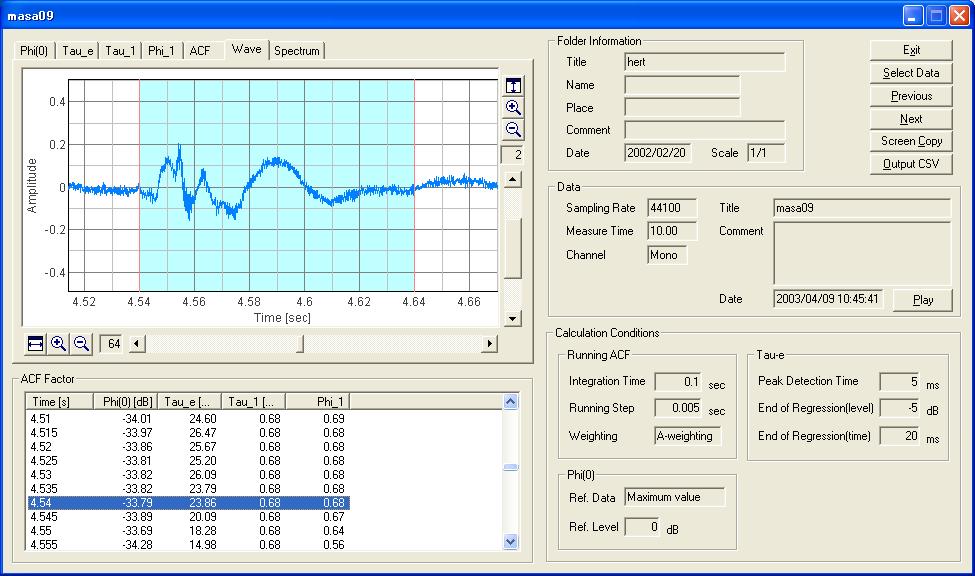
Similarly, the second heart sound is analyzed. The figure below is the temporal waveform zoomed in to the second sound. The data between 4.54 and 4.64 s is selected.
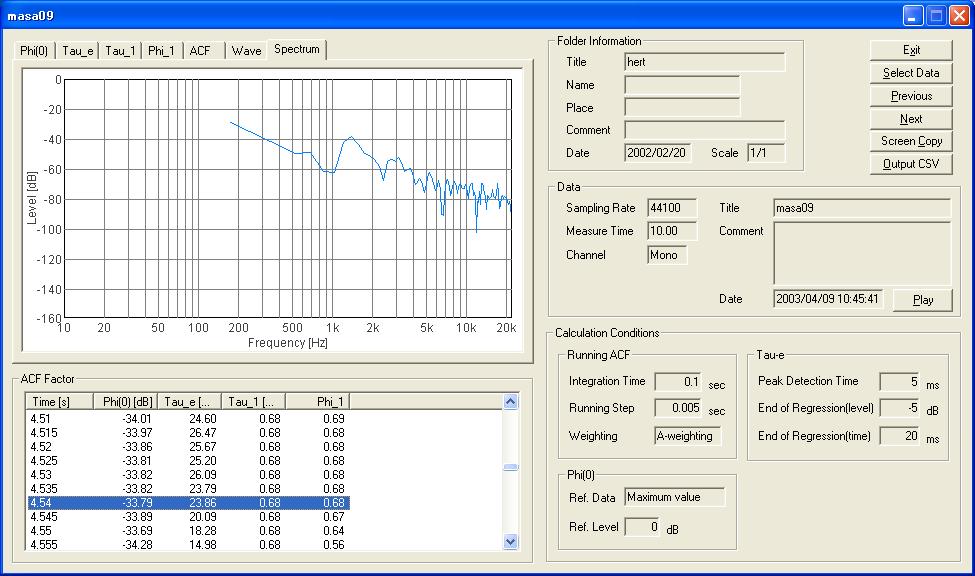
The next figure is the spectrum of the second heart sound. The prominent component at 1470 Hz is found as same as the first heart sound. Next, the ACF analysis is performed.
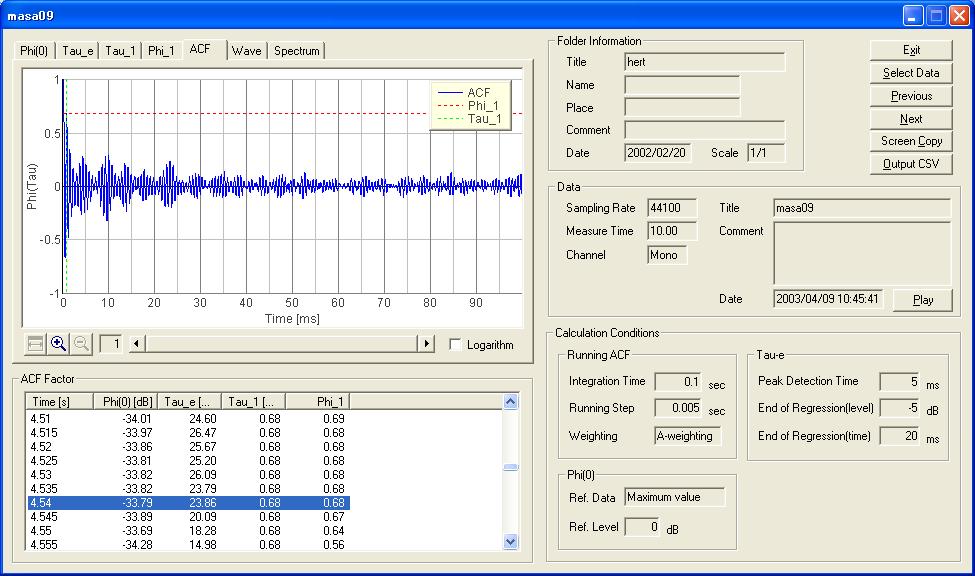
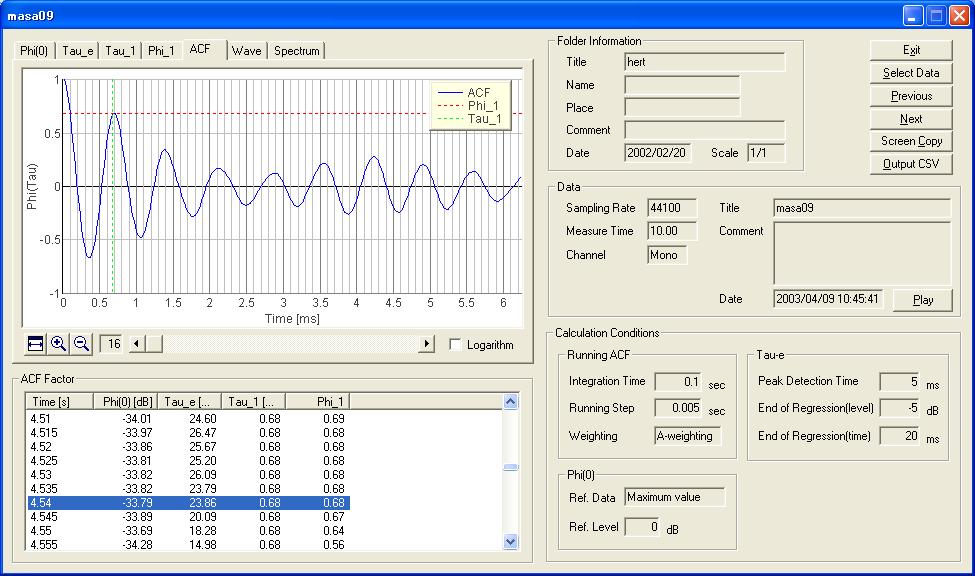
The next figure is the ACF of the second sound. The time axis between 0 and 100 ms is shown. Although it is not visible in this graph, the first peak of the ACF (Tau_1 value) is calculated as 0.68 ms as shown in the table below the graph. It corresponds to 1000 / 0.68 = 1470 Hz as found in the spectrum. The fundamental period is found around 4 ms. The ACF also consists of the lower frequency components, such as 10 ms (100 Hz) and 23 ms (43 Hz).
The time axis of the above graph is zoomed in to x16. I can see that the fundamental frequency is 238 Hz (Tau_1 = 4.2 ms) and the prominent frequency is 1470 Hz (0.68 ms). I will compare the ACFs of the first and the second sounds.
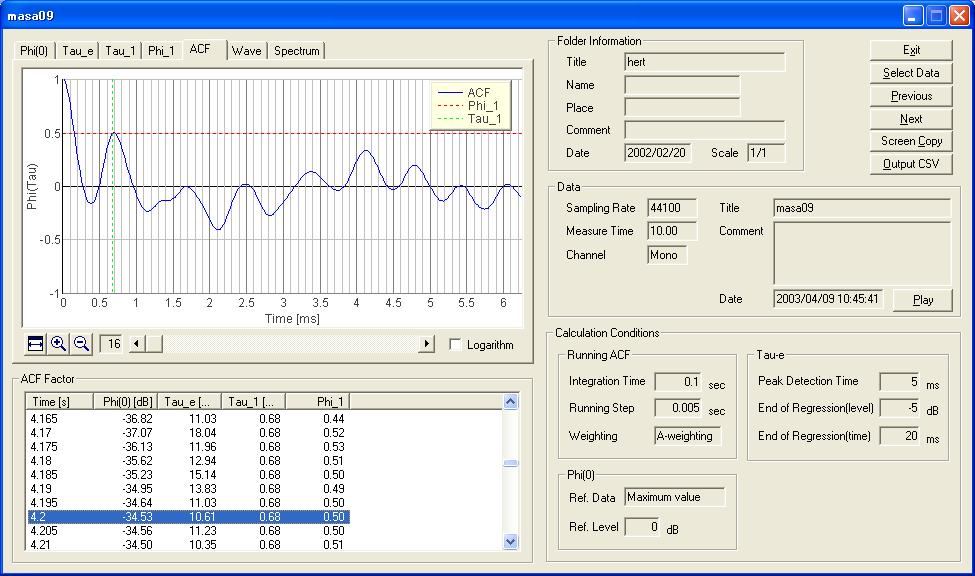
This is the ACF of the first heart sound. Positions of the peaks are same (0.68 ms and 4.2 ms), but the waveform is different.
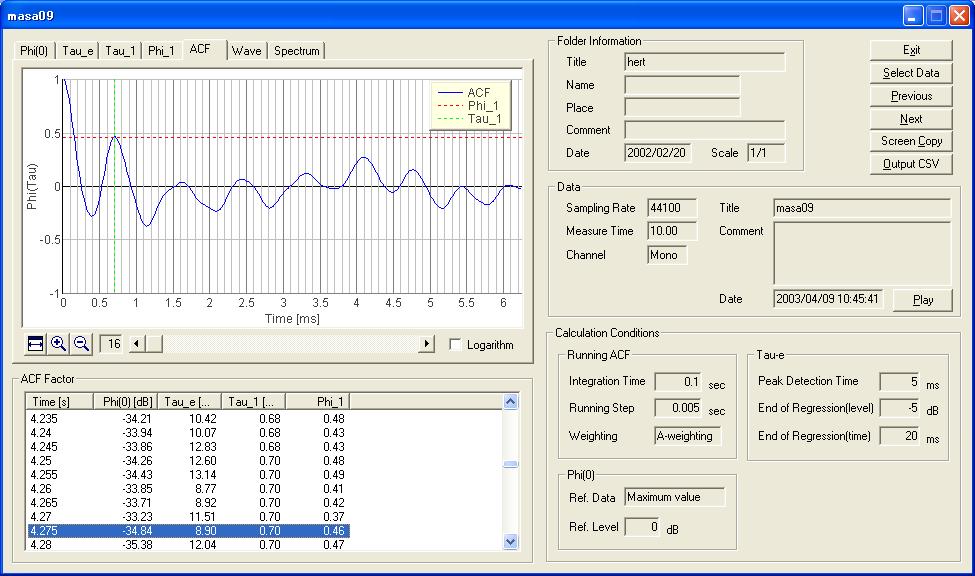
This is the ACF of the second half of the first sound.
This time, I showed the spectra of the first and the second heart sounds. It was found that the frequency characteristics of these two components are almost the same.
The ACF waveforms were different for two components, although the fundamental and the prominent periods were the same. The ACF of the second sound was more periodical, probably because the low frequency component is dominant in the first sound.
The functional difference of the first and the second heart sounds is as follows. The first sound is caused by the closure of the mitral valve and the tricuspid valve. The heart is shrunk to send the blood to the body. The second sound is caused by the closure of the aortic valve and the pulmonary valve. The heart is expanded to store the blood.
2004/07/23
April 2003 by Masatsugu Sakurai