| TOP | STORE | DSSF3 | Mmlib | Support | Contact Us |
![]() About
this manual
About
this manual ![]() Introduction
of RA
Introduction
of RA ![]() Operation
Guide
Operation
Guide ![]() Impulse
response
Impulse
response ![]() Running
ACF
Running
ACF ![]() Reference
Manual
Reference
Manual ![]() Appendix
Appendix
Appendix of RA's program manual
Input and output device selection
An input device selection in RA is being interlocked with the volume control of
Windows. So, after this volume is adjusted, volume control of Windows may not be
changed.
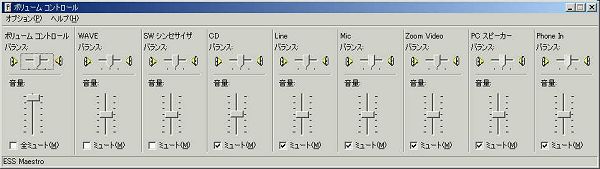
However, selection or volume control of an output device cannot be set up here. It is because volume control is separately required for each output. It is necessary to set these up directly in the Windows volume control.
Caution: don't select a microphone by the output device. If you do so, the microphone input will be outputted directly and howling will be caused.
Time window in the FFT analyzer
The time window is used to decrease extra frequencies because frequency response is sometimes different because of a period with which a processed signal is taken out. When there is a portion that rapidly changes around the edge of the period taken out, it may influences the frequency response very much. Therefore, it is desired that the difference of the frequency response that depends on the chosen period is as small as possible. This "Time window" function prevents occurrence of high frequency components which is not included originally. As a shape of decrease is different by a kind of time window, it should be chosen properly. But in most cases, default setting of Hanning window is appropriate.
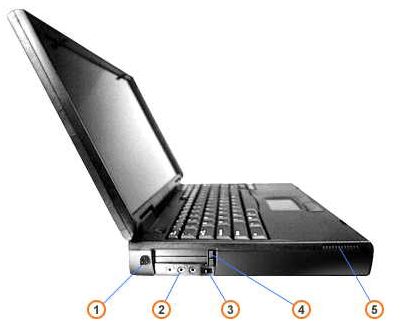
The figure below is an illustration of the functional composition inside a PC.
The volume of the input device in RA controls the Windows volume control
(recording). This is called "software volume."
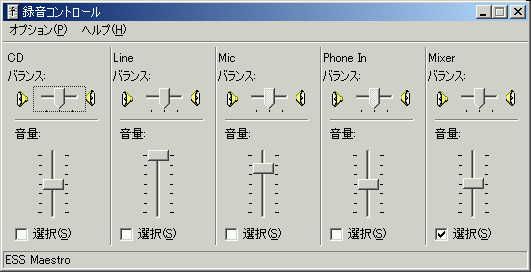
Volume control of Windows should be silent except WAVE.
The mechanical volume attached to the computer is called "hardware volume".
In the case of DELL INSPIRON 7500, 3 in this figure is called a "sound volume
dial".
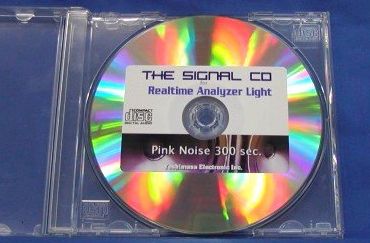
Test signal CD
For the accurate measurement, the signal CD is convenient. Clear test signals
(without distortion, and with flat frequency characteristic) can be obtained
easily. We recommend you to purchase this kind of CD even if you are using the
DSSF3.
Time resolution and frequency resolution in the FFT analyzer
In the FFT analyzer, the input wave data is extracted for every FFT size, then calculated, and the result is displayed one by one.
Display interval, or time resolution [s] is calculated as FFT size / sampling rate.
Frequency resolution [Hz] is its reciprocal and calculated as sampling rate / FFT size.
The time resolution and the frequency resolution could not be improved simultaneously. To solve the problem, FFT calculation is not performed for every FFT size, but performed with shifting data at a shorter interval. Consequently, the apparent time resolution can be improved with the frequency resolution maintained.
However, when the time resolution is raised, the number the FFT calculation within unit time and display processing will increase, and so the CPU load will much increased. Set the time resolution, looking at the rate of CPU use by the task manager of Windows.
New: In the RA Version 5.0.3.4 or later, the maximum time resolution of 8x is available.
About the correlation function
The cross-correlation function is used to investigate the similarity of two time series signals x(t) and y(t). Generally, it is expressed as the function of t (delay time) to show the time change of the similarity. Especially, the correlation function that shows the similarity of the signal itself is called the auto-correlation function (ACF). The ACF is a useful tool in signal analysis because it can be used to detect the periodicity of the signal. The ACF is defined as the following equation. In the equation, x(t) is the input signal, t is the delay time, and 2T is the integration time. The running ACF measured in RA is the short term ACF, which is calculated at a short interval with shifting the input data.
In RA and SA, three parameters can be set. The first is Integration time and the second is Max delay time (in RA, it is called Time range). These parameters decide how to calculate the ACF for each data frame. The illustration below shows the calculation process of the running ACF for two successive data frames. A portion of the input signal (C-D) is shifted, multiplied with the original signal (A-B), and summed up to calculate the correlation value at each sample (t). The max delay time decides the time range of t in which the ACF is calculated. When the max delay time is longer than the integration time, the ACF is calculated up to the max delay time. When the max delay time is shorter than the integration time, the ACF is calculated up to the max delay time too. The third parameter, Running step decides the calculation interval of the running ACF.
| Y Store. |
|
|
| TOP | STORE | DSSF3 | RAE | RAD | RAL | MMLIB | Support | Contact Us |
If you have questions or comments about this
page,
feel free to contact us by email ymec@ymec.com
or by online
inquiry form.